A smartphone is a multifunctional device that integrates the core features of a traditional mobile phone with advanced computing capabilities. It enables users to perform a wide range of activities, including voice communication, messaging, internet browsing, photography, video streaming, and the use of various applications. Equipped with touchscreen interfaces and operating systems such as iOS and Android, smartphones support extensive app ecosystems that enhance functionality and user experience.
Smartphone adoption has become widespread across global markets. Worldwide, 82% of individuals aged 10 years and above own a mobile phone. Mobile phone ownership has achieved near-universal penetration in high-income economies, with adoption rates exceeding 95%. Upper-middle-income economies have also demonstrated strong adoption levels, surpassing 90% penetration. In contrast, mobile phone ownership remains comparatively lower in low-income economies, where 53% of the population aged 10 years and above own a mobile phone.
Editor’s Picks
Smartphone ownership in the United States reached 91% in 2025, reflecting the widespread adoption of mobile technology across the country.
Smartphone penetration remained highly consistent across genders, with ownership rates of 90% among men and 91% among women in the U.S.
Globally, 7.64 billion smartphones were actively in use, serving an estimated 5.83 billion smartphone users.
Mobile devices accounted for 62.23% of global web traffic, highlighting their dominant role in digital connectivity and online engagement.
The United States achieved more than 99% 5G penetration, while North America reached nearly 95%, significantly surpassing the global average of 36%.
The U.S. market represented 341 million 5G connections, underscoring its position as a leading adopter of next-generation mobile networks.
Global 5G connections reached 2.8 billion, recording a 35% year-over-year increase and demonstrating rapid expansion of 5G infrastructure and adoption.
Smartphone usage remained deeply integrated into daily routines, with Americans checking their phones an average of 186 times per day, equivalent to 11.6 times per hour.
Millennials accounted for 55.5% of individuals who recycled or traded in unwanted technology devices in the United States, indicating strong participation in sustainable technology practices.
California led the nation in technology recycling activity, representing 20.5% of all devices recycled or traded in across the U.S.
Apple device owners demonstrated the highest recycling participation, recycling 13.8% more devices than Samsung device owners.
Mobile technologies and services generated US$7.6 trillion for the global economy in 2025, accounting for 6.4% of global GDP.
The economic contribution of the mobile industry is projected to reach US$11.3 trillion by 2030, supported by the accelerating adoption of 5G, artificial intelligence, and other digital technologies.
Apple achieved its highest quarterly share during Q4 2025, accounting for 67% of U.S. smartphone shipments.
Samsung reached its strongest quarterly performance in Q2 2025 with a 27% market share.
General Statistics
Smartphone shipments in the United States totaled 33.4 million units during Q1 2026, representing a 3% decline compared to the previous year.
Apple recorded a 1 percentage-point increase in shipment share on an annual basis, while its share was 9 percentage points lower than the previous quarter.
The iPhone 17 lineup contributed 70% of Apple’s overall smartphone shipments.
Global adoption of eSIM-enabled devices is anticipated to reach 2.5 billion connections by 2028, with eSIM technology expected to comprise 42% of total SIM usage by 2030.
The worldwide smartphone average selling price is expected to rise from US$467 in 2025 to US$565 in 2026.
Mobile applications continue to dominate smartphone engagement, accounting for more than 90% of total mobile usage time.
Revenue generated through in-app purchases reached US$167 billion in 2025, reflecting a 10.6% increase from the previous year.
Consumer spending on non-gaming applications reached US$85.6 billion, surpassing the US$81.8 billion generated by gaming applications.
The value of mobile commerce transactions in the United States is projected to increase from US$564 billion in 2024 to US$649 billion in 2025.
The global mobile shopping user base has expanded to 1.65 billion consumers.
Mobile applications facilitated 54% of all mobile commerce transactions, exceeding the share conducted through mobile web browsers.
Downloads of shopping applications increased by 70% overall, while installations on iOS devices rose by 123%.
Mobile users downloaded 142.2 billion applications and games in 2025, equivalent to 389.6 million downloads per day.
The leading mobile app marketplaces introduced 5,244 new applications within a single 24-hour period.
Weekly App Store usage exceeded 850 million users, while cumulative developer earnings surpassed US$550 billion.
Global revenue from mobile app monetization totaled US$167 billion in 2025, while the App Store ecosystem supported US$1.4 trillion in billings and sales.
Time spent on mobile applications reached 5.3 trillion hours during 2025, averaging 3.6 hours per user each day.
Road accidents involving distracted drivers resulted in 3,208 fatalities across the United States in 2024, highlighting the continued safety risks associated with mobile phone usage while driving.
Americans’ Smartphone Usage and Habits
72.2% of Americans use their smartphones during work hours.
87.4% of individuals use their smartphones while watching television.
56.4% of consumers use their smartphones during dinner.
67.9% of users report smartphone usage while in the restroom.
60.7% of Americans have sent text messages to someone in the same room.
49.6% of smartphone users keep their phones nearby while sleeping.
41.3% of consumers experience anxiety when smartphone battery levels fall below 20%.
84.6% of individuals check their smartphones within 10 minutes of waking up.
76.3% of users report feeling uneasy when leaving their smartphones at home.
45.8% of consumers consider themselves addicted to their smartphones.
53.1% of individuals have never gone longer than 24 hours without their smartphone.
40.1% of users engage with their smartphones while on a date.
29.3% of consumers report smartphone usage while driving.
82.7% of mobile subscribers are enrolled in unlimited mobile plans.
71% of individuals spend more time using their smartphones than with their romantic partners.
52% of consumers spend 3–4 additional hours per day on their smartphones compared to time spent with their significant others.
Smartphone usage exceeds partner interaction among 78% of women and 64% of men.
17% of women and 7% of men report interrupting or being willing to interrupt intimacy to check their smartphones.
54% of individuals prefer spending time with their smartphone rather than with their partner.
76% of consumers check their smartphone before greeting their partner in the morning, including 80% of women.
30% of individuals prefer communicating with their partner through their smartphone even when both are at home.
36% of consumers check their smartphone in front of their date or partner on Valentine’s Day.
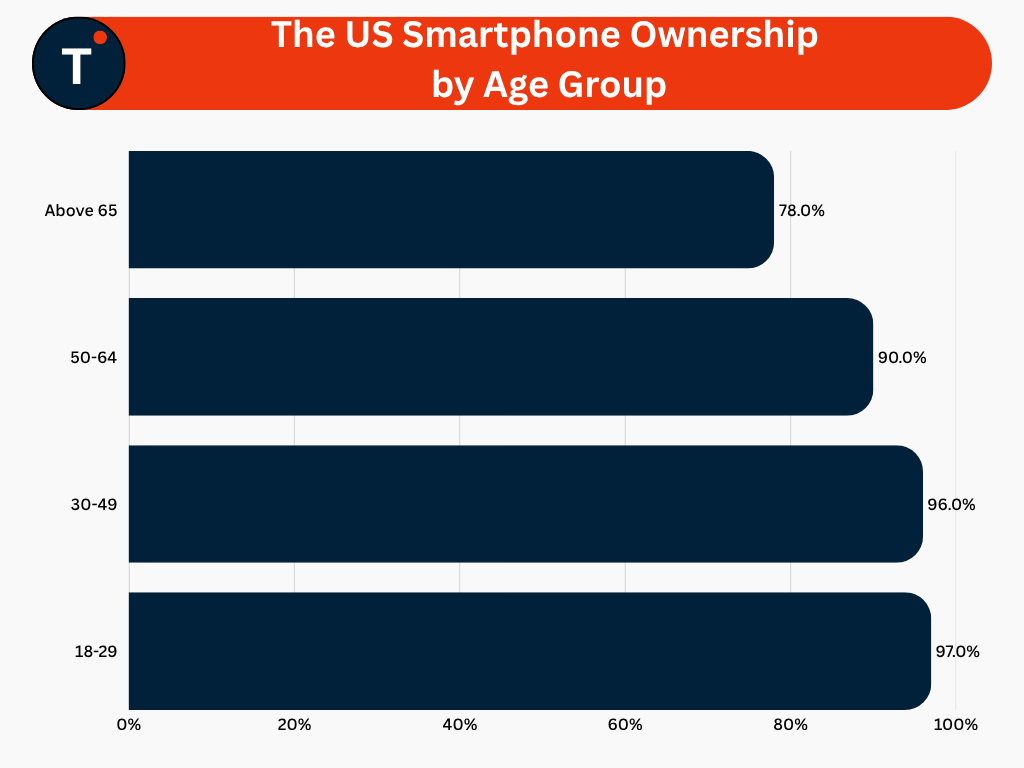
The US Smartphone Ownership by Age Group
Smartphone ownership among adults aged 18–29 reached 97%, the highest across all age groups.
Adults aged 30–49 recorded a smartphone ownership rate of 96%, reflecting near-universal adoption.
Smartphone penetration among the 50–64 age group stood at 90%.
Among adults aged 65 and above, smartphone ownership reached 78%.
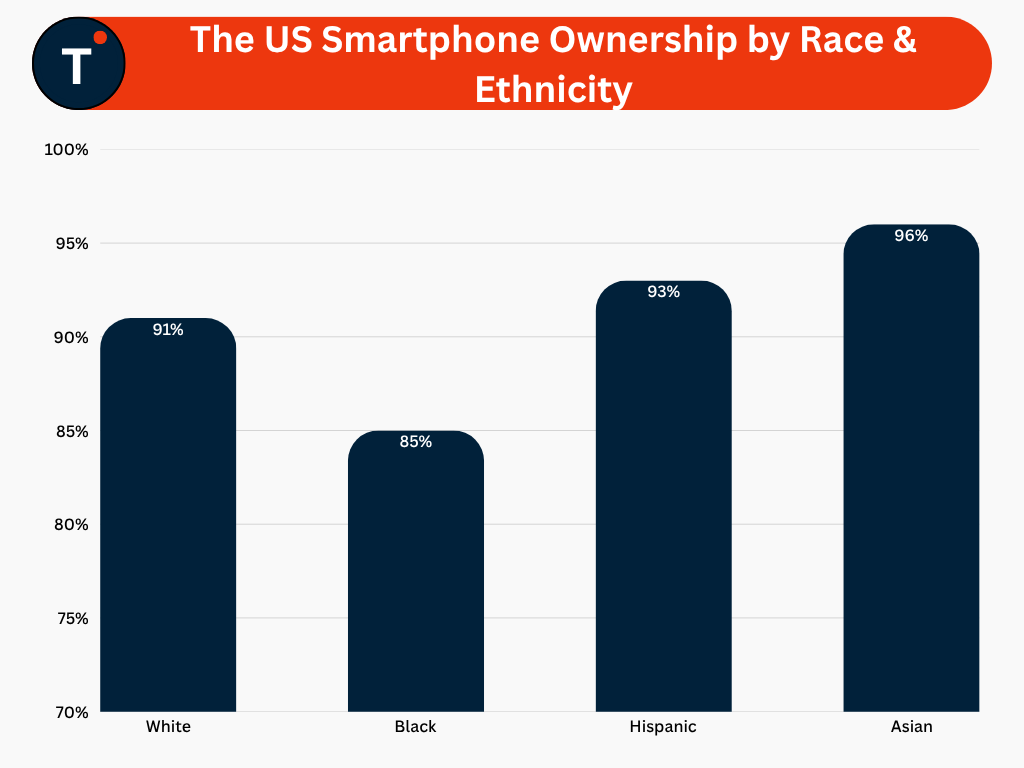
The US Smartphone Ownership by Race & Ethnicity
Asian Americans recorded the highest smartphone ownership rate at 96%.
Smartphone ownership among Hispanic Americans reached 93%.
White Americans reported a smartphone ownership rate of 91%.
Black Americans recorded smartphone ownership of 85%.
The US Smartphone Ownership by Household Income
Household Income
Ownership
Less than $30,000
82%
$30,000- $69,999
89%
$70,000- $99,999
96%
Above $100,000
97%
Households earning above US$100,000 recorded the highest smartphone adoption rate at 97%.
The US$70,000–US$99,999 income group followed closely with a penetration rate of 96%.
Smartphone adoption among households earning US$30,000–US$69,999 reached 89%.
The below-US$30,000 income segment registered a smartphone adoption rate of 82%.
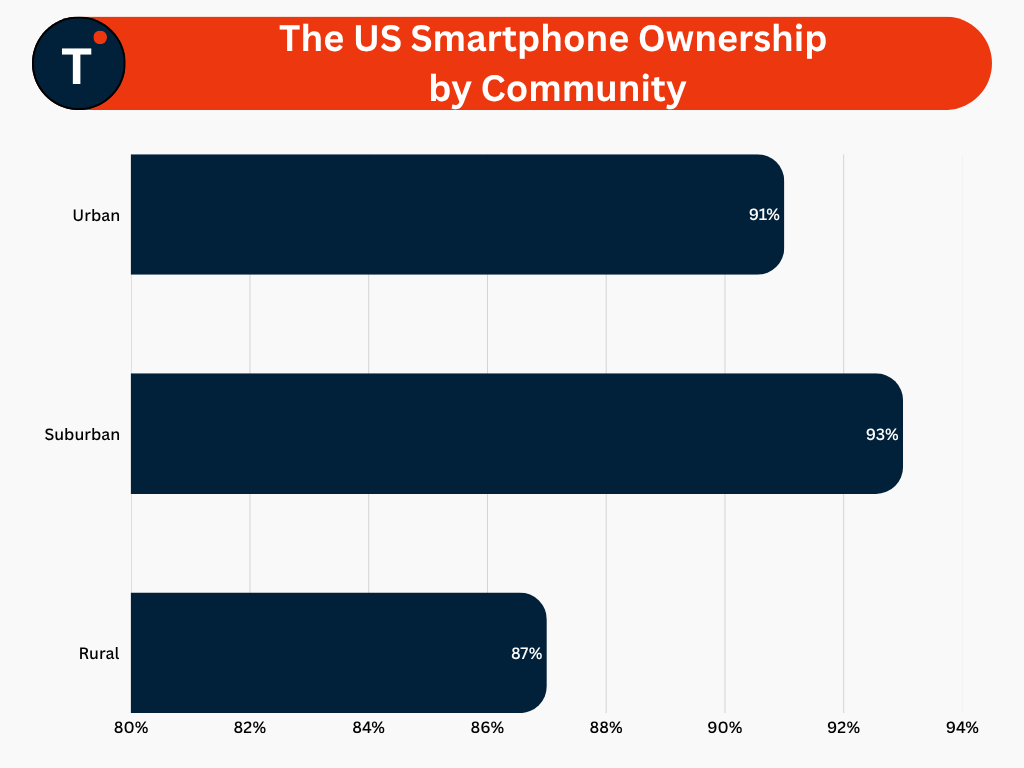
The US Smartphone Ownership by Community
Suburban areas recorded the highest smartphone adoption rate at 93%.
Smartphone penetration in urban communities reached 91%.
Rural areas reported a smartphone adoption level of 87%.
Adoption rates remained above 85% across all community types.
Global Smartphone Market Overview
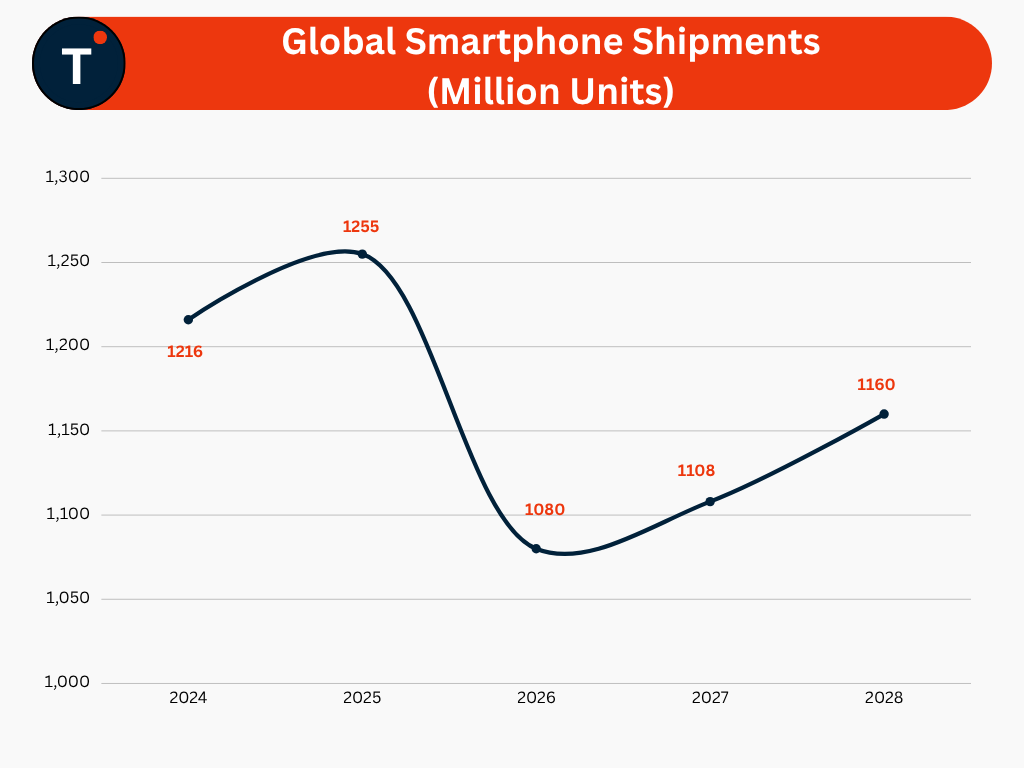
Global smartphone shipments reached 1.25 billion units in 2025, reflecting 2% year-over-year growth.
The smartphone industry concluded Q4 2025 with a 4% increase in shipments compared to the same period of the previous year.
Apple achieved its highest annual shipment volume on record, with iPhone shipments increasing 7% to 240.6 million units in 2025.
Samsung returned to annual growth in 2025, recording a 7% increase in shipments after three consecutive years of decline and finishing marginally behind Apple.
Global smartphone shipments are projected to decline 13.9% year-over-year in 2026, falling to 1.08 billion units.
LPDDR4/5 memory prices are expected to increase nearly threefold in Q2 2026 compared with Q4 2025 amid tightening memory supply conditions.
LPDDR4 memory availability is forecast to decline by more than 40% in 2026, creating significant challenges for lower-end smartphone manufacturers and emerging markets.
The sub-US$150 smartphone segment faces substantial contraction, with availability expected to be significantly reduced across selected markets.
Global smartphone wholesale prices increased 14% during the first quarter, reflecting rising cost pressures across the value chain.
Global Smartphone Shipments by Brand Market Share
Brands
2024
2025
2026
2027
Apple
18%
20%
23%
23%
Samsung
18%
19%
21%
21%
Xiaomi
14%
13%
12%
12%
Vivo
8%
8%
8%
8%
Oppo
7%
7%
7%
7%
Transsion
8%
7%
6%
6%
Honor
5%
6%
6%
6%
Huawei
4%
4%
4%
4%
Others
16%
15%
13%
12%
Apple expanded its market share from 18% in 2024 to 20% in 2025 and is projected to reach 23% by 2026, maintaining the same level through 2027.
Samsung increased its share from 18% in 2024 to 19% in 2025, with projections indicating further growth to 21% by 2026 and 2027.
Xiaomi’s market share declined from 14% in 2024 to 13% in 2025 and is expected to decrease further to 12% by 2026.
Vivo maintained a stable market presence, holding an 8% share throughout the 2024–2027 period.
Oppo’s market share remained unchanged at 7% between 2024 and 2027.
Transsion recorded a decline from 8% in 2024 to 7% in 2025, with its share projected to reach 6% by 2026 and remain stable thereafter.
Honor strengthened its position, increasing from 5% in 2024 to 6% in 2025 and maintaining that level through 2027.
Huawei sustained a consistent 4% market share throughout the forecast period.
The collective share of other smartphone brands declined from 16% in 2024 to 15% in 2025 and is projected to fall to 12% by 2027.
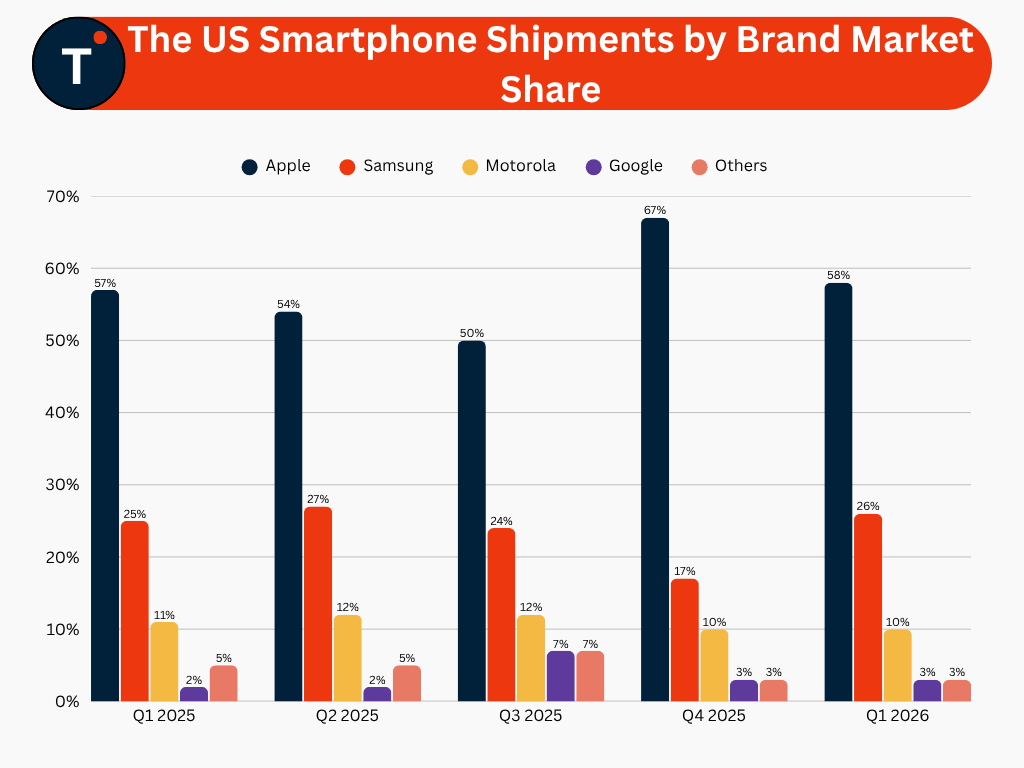
The US Smartphone Shipments by Brand Market Share
Apple led the U.S. smartphone market throughout the period, with its share moving from 57% in Q1 2025 to 54% in Q2 2025 and 50% in Q3 2025, before rising to 67% in Q4 2025 and settling at 58% in Q1 2026.
Samsung maintained its position as the second-largest smartphone brand, recording market shares of 25% in Q1 2025, 27% in Q2 2025, 24% in Q3 2025, 17% in Q4 2025, and 26% in Q1 2026.
Motorola’s market share remained within a narrow range, accounting for 11% in Q1 2025, 12% in Q2 and Q3 2025, and 10% in both Q4 2025 and Q1 2026.
Google captured 2% of smartphone shipments in Q1 and Q2 2025, increased its share to 7% in Q3 2025, and recorded 3% in both Q4 2025 and Q1 2026.
The collective share of other smartphone brands stood at 5% in Q1 and Q2 2025, increased to 7% in Q3 2025, and declined to 3% in Q4 2025 and Q1 2026.
The US Smartphone Screen Time Statistics
Average daily smartphone usage among Americans reached 5 hours and 16 minutes.
Gen Z recorded the highest screen time, averaging 6 hours and 27 minutes per day on smartphones.
Millennials spent an average of 5 hours and 28 minutes per day on their smartphones.
Gen X registered daily smartphone usage of 4 hours and 48 minutes.
Baby Boomers recorded the lowest screen time among the reported generations, averaging 4 hours and 19 minutes per day.
More than half of Americans (53%) expressed a desire to reduce their smartphone usage in 2025.
The share of Americans seeking to cut down smartphone usage increased by 33% compared to 2023.
Among Gen Z, 66% indicated an intention to reduce time spent on smartphones, representing the highest share across all generations.
A total of 59% of Millennials reported wanting to decrease smartphone usage.
Among Gen X respondents, 51% expressed an interest in reducing smartphone screen time.
Baby Boomers recorded the lowest intention to reduce smartphone usage, with 35% indicating plans to cut back.
Social Media Platform Usage Among U.S. Adults
Social Media Platform
Share of U.S. Adults Using the Platform (%)
YouTube
84%
Facebook
71%
Instagram
50%
TikTok
37%
WhatsApp
32%
Reddit
26%
Snapchat
25%
X (Twitter)
21%
Threads
8%
Bluesky
4%
Truth Social
3%
YouTube recorded the highest adoption rate among U.S. adults, with 84% reporting platform usage.
Facebook ranked second, reaching 71% of U.S. adults.
Instagram usage stood at 50%, representing adoption by half of the adult population.
TikTok achieved a penetration rate of 37% among U.S. adults.
WhatsApp reached 32% of adults, surpassing several other social networking platforms.
Reddit accounted for 26% of adult users, slightly ahead of Snapchat at 25%.
X (formerly Twitter) recorded a usage rate of 21% among U.S. adults.
Threads achieved 8% adoption, reflecting its emerging presence in the social media landscape.
Bluesky accounted for 4% of U.S. adult users.
Truth Social recorded the lowest adoption rate among the reported platforms at 3%.
Smartphone Brand Loyalty
iPhone recorded a loyalty rate of 96.4%, increasing from 91.9% in 2021.
Only 3.6% of iPhone users switched to an alternative smartphone brand.
Android devices registered a loyalty rate of 86.4%, while the switching rate stood at 13.6%.
Android users were nearly four times more likely to switch brands compared to iPhone users.
Samsung’s loyalty rate reached 90.1%, up from 74.0% in 2021.
Samsung recorded a switching rate of 9.9% among its user base.
Google’s loyalty rate increased to 86.8%, compared with 65.2% in 2021.
Brand switching among Google smartphone users stood at 13.2%.
The loyalty gap between iPhone and Android devices reached 10 percentage points.
Child Smartphone Usage and Parental Attitudes
A total of 42.0% of children spend more than 30 hours per week on mobile phones, equivalent to an average of 4.3 hours per day.
Mobile gaming is the most common smartphone activity among children, with 57.0% using their devices for gaming.
Only 18.0% of children use mobile phones as a tool for completing homework or educational activities.
Early smartphone exposure is increasingly common, with 12.0% of children first using a mobile phone between the ages of 1 and 2 years.
Peace and quiet was identified as the primary reason for providing children with mobile phones by 40.0% of parents.
A majority of parents (68.0%) viewed mobile phone usage as having a positive impact on their child’s overall development.
Approximately 25.0% of parents spent around US$250 on a mobile phone for their child.
A smaller segment of parents (4.0%) reported spending more than US$850 on a smartphone for their child.
Smartphones remain a popular holiday gift, with over 40.0% of parents planning to purchase a device for their teenager during the Christmas season.
Parental oversight remains high, with 88.0% of parents knowing the passcode to their child’s mobile phone.
Concerns regarding in-app spending persist, as 67.1% of U.S. parents worry that their children spend excessive amounts on mobile gaming.
Environmental Awareness Among Smartphone Users
Environmentally friendly manufacturing was considered a very important purchase factor by 22.0% of iPhone users, compared with 18.3% of Android users.
The importance of environmentally responsible smartphone manufacturing was recognized by 55.6% of iPhone users and 52.0% of Android users.
A total of 63.4% of iPhone users indicated a willingness to pay a premium for a more environmentally friendly smartphone, compared with 55.9% of Android users.
Resale activity was higher among iPhone users, with 57.4% selling their device when upgrading, versus 43.2% of Android users.
Retention of old devices in storage was reported by 19.7% of iPhone users, compared with 30.5% of Android users.
Secondary device usage was less common among iPhone users, with 8.0% retaining older smartphones for this purpose, compared with 15.2% of Android users.
Device gifting was reported by 10.9% of iPhone users, exceeding the 8.1% recorded among Android users.
Disposal through household waste was reported by 3.9% of iPhone users and 3.0% of Android users.
Recent Developments
July 2026: Apple entered a multiyear agreement with Broadcom valued at more than US$30 billion to develop custom silicon components and advanced wireless connectivity technologies, with production expected to exceed 15 billion U.S.-manufactured chips.
June 2026: Apple introduced the next generation of Apple Intelligence, enhanced Siri AI capabilities, advanced parental control features, and a broad range of software upgrades across its ecosystem.
May 2026: Samsung Electronics launched the One UI 9 beta program for the Galaxy S26 series, based on Android 17, featuring expanded creative tools, greater customization options, improved accessibility, and enhanced security capabilities.
May 2026: Samsung Electronics and LG Uplus announced a collaboration to advance Integrated Sensing and Communication (ISAC) technology for future 6G networks.
February 2026: Ericsson successfully completed the world’s first 6G pre-standard over-the-air (OTA) session, representing a significant milestone in the development of commercial 6G networks.
February 2026: Samsung Electronics, in collaboration with KT Corporation and Keysight Technologies, verified eXtreme multiple-input multiple-output (X-MIMO) technology in the 7 GHz spectrum band, a key candidate frequency for future 6G deployment.
December 2025: The U.S. government announced a strategic initiative to support national leadership in 6G development, including plans to clear the 7.125–7.4 GHz spectrum band for future commercial 6G applications.
September 2025: Apple introduced the iPhone 17 Air, becoming the company’s first globally released smartphone model designed without a physical SIM tray, further advancing eSIM adoption.
Conclusion
Smartphone adoption remains highly mature across developed markets, with ownership rates exceeding 90% among most demographic and income groups, highlighting the device’s essential role in daily life.
Consumer engagement with smartphones continues to strengthen, driven by extensive app usage, growing mobile commerce activity, and increasing time spent on digital platforms.
Apple and Samsung maintain leadership positions in the global smartphone industry, supported by strong brand loyalty, expanding ecosystem offerings, and continued innovation.
The smartphone market is undergoing a transition toward premium devices, with rising average selling prices and increasing adoption of advanced technologies such as eSIM, AI-powered features, and next-generation connectivity solutions.
Sustainability considerations are becoming more influential in purchasing and upgrade decisions, with growing consumer interest in environmentally responsible manufacturing and device recycling.
Rapid advancements in 5G and emerging 6G technologies are expected to enhance network capabilities and support the next phase of smartphone innovation and connectivity.
Add TriCityLocalNews as a Preferred Source on Google for instant updates!
Rob Enderle is a Principal Analyst and seasoned market strategist with over 13 years of experience advising global technology leaders, including Microsoft, IBM, Intel, HP, and Infosys. Holding an MBA from the Massachusetts Institute of Technology (MIT), Rob specializes in helping enterprises anticipate technology shifts, identify lucrative business opportunities, and execute high-impact "zero dollar marketing." As an expert industry commentator, he extensively covers startup funding, mergers and acquisitions, and corporate growth predictions, providing companies with the actionable intelligence needed to build credible, lasting dialogues with their target markets.
We use cookies to ensure that we give you the best experience on our website. If you continue to use this site we will assume that you are happy with it.