







Peanut butter consumption has expanded globally, supported by rising demand for natural, high-protein, and additive-free food products. While the United States remains a major consumption market, adoption is increasing across other regions as peanut butter gains popularity as a versatile and nutrient-rich food. Growing interest in plant-based, vegan, and keto-friendly diets has further supported demand, alongside its increasing use in sports nutrition, baked goods, sauces, and energy beverages.
Product innovation continues to align with evolving consumer preferences, with manufacturers introducing varieties free from added sugar and palm oil. Advances in food technology have improved texture and consistency, enabling creamier products with reduced reliance on artificial stabilizers. The growing use of high-oleic peanuts also supports improved nutritional characteristics and extended shelf life, strengthening the product’s positioning as a healthier and more sustainable food option.
Who Invented Peanut Butter?
- 1884: Marcellus Gilmore Edson patented peanut paste, produced by milling roasted peanuts between two heated surfaces.
- 1895: Dr. John Harvey Kellogg patented a process for producing peanut butter from raw peanuts.
- 1903: Dr. Ambrose Straub patented a machine designed to manufacture peanut butter, supporting the development of commercial-scale production.
Editors’ Choice
- Peanut butter represents more than 60% of peanuts consumed for food in the United States, highlighting its strong position in the country’s peanut industry.
- U.S. regulations require products labeled “peanut butter” to contain at least 90% peanuts.
- U.S. per capita peanut butter consumption reached a record 4.4 lbs (2 kg), compared with 3.1 lbs (1.4 kg) in Canada.
- 94% of U.S. households have at least one jar of peanut butter in their pantry, according to the National Peanut Board.
- Global peanut butter consumption reached 2,064.58 kilotons in 2025 and is projected to increase to 2,158.59 kilotons in 2026.
- Global peanut butter consumption is projected to reach 3,369.09 kilotons by 2035, indicating sustained long-term demand.
- U.S. peanut butter consumption totaled 866.12 kilotons in 2025 and is projected to reach 897.13 kilotons in 2026.
- U.S. peanut butter consumption is projected to reach 1,277.71 kilotons by 2035.
- The United States accounted for 42.5% of the global peanut butter market value in 2025, reinforcing its position as a leading market.
General Statistics
- 5 of the top 10 best-selling candy bars in the United States contain peanuts or peanut butter.
- 1 acre of peanuts can produce enough peanuts for approximately 30,000 peanut butter sandwiches, highlighting the crop’s high productivity.
- Peanut butter businesses can achieve 30%–60% profit margins, depending on scale and distribution strategy.
- Approximately 540 peanuts are required to produce 12 ounces of peanut butter, equivalent to about 45 peanuts per ounce, according to the National Peanut Board.
- A single peanut plant can produce approximately 40 peanuts.
- Producing 1 ounce of peanuts requires 3.2 gallons of water, reflecting the crop’s resource requirements.
- The average U.S. peanut farm covers 200 acres.
- An average child consumes 1,500 peanut butter and jelly (PB&J) sandwiches before graduating from high school.
- Georgia, Alabama, Florida, North Carolina, South Carolina, and Texas collectively account for more than 95% of U.S. peanut production.
- Georgia contributes more than 50% of U.S. peanut production, followed by Alabama, Florida, and Texas.
- 30% of Americans identify PB&J sandwiches as their favorite comfort food, compared with 21% for macaroni and cheese and 19% for grilled cheese sandwiches.
- 50% of millennials identify PB&J as their preferred lunch option, while 37% consume PB&J sandwiches more than twice per week.
- 60% of parents consider PB&J the easiest lunch option, while 30% eat the sandwich themselves when preparing it for their children.
- 74% of grandparents favor PB&J sandwiches because of their association with childhood memories.
- Peanuts are among the 8 most common food allergens in the United States, affecting 1.4% of the U.S. population.
- Daily peanut consumption has been associated with a 21% lower overall mortality risk and a 38% lower risk of heart disease.
What Is the Global Peanut Butter Market Size?
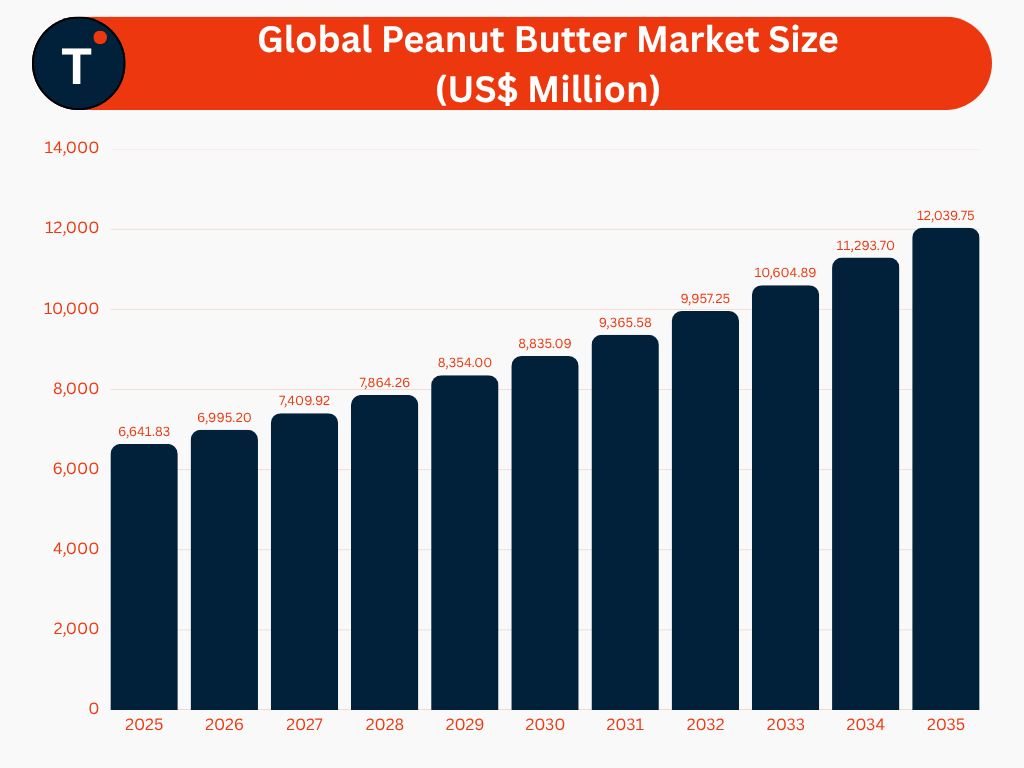
- The global peanut butter market was valued at US$ 6,641.83 million in 2025.
- Global market value is projected to reach US$ 6,995.20 million in 2026.
- The market is projected to expand at a CAGR of 6.2% from 2026 to 2035, reflecting sustained growth in global demand.
- By 2035, the global peanut butter market is projected to reach US$ 12,039.75 million.
Which Region Dominates the Global Peanut Butter Market?
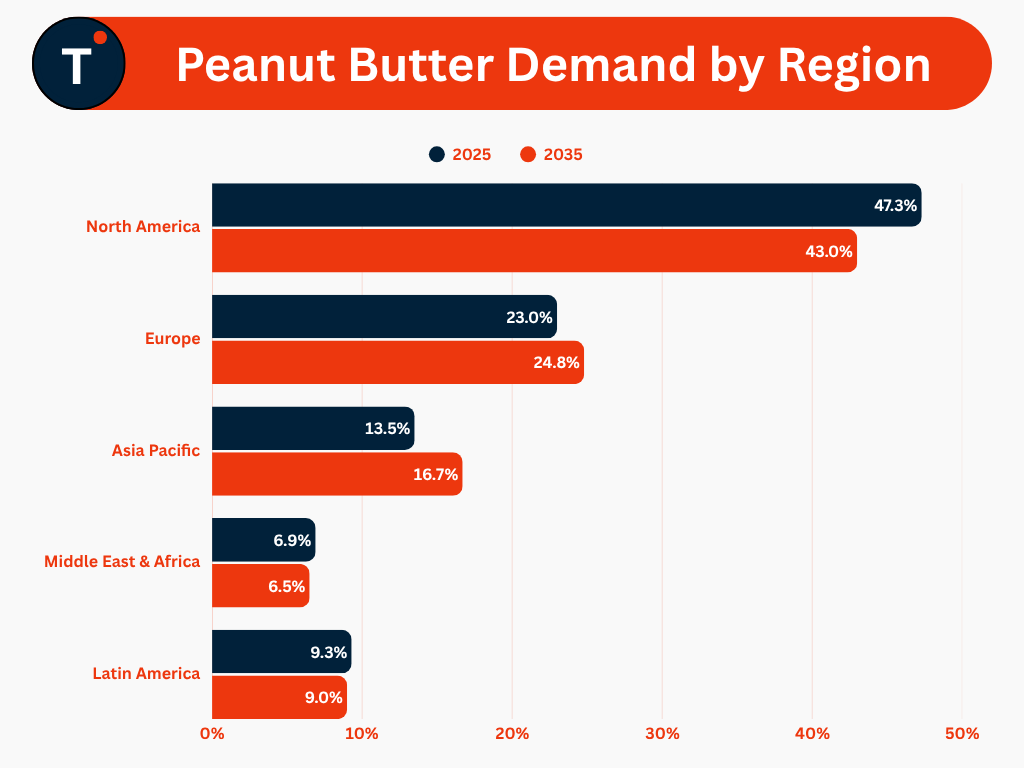
- North America dominated the global peanut butter market with a 47.3% share in 2025, making it the leading regional market.
- The North American peanut butter market was valued at US$ 3,140.82 million in 2025 and is projected to reach US$ 5,181.46 million by 2035, expanding at a CAGR of 5.2%.
- Europe accounted for 23% of the global peanut butter market in 2025, ranking as the second-largest regional market.
- The European peanut butter market was valued at US$ 1,528.07 million in 2025 and is projected to reach US$ 2,988.03 million by 2035, registering a CAGR of 7.0%.
- Asia Pacific is projected to be the fastest-growing regional market, with a CAGR of 8.5% during the forecast period.
- Asia Pacific held a 13.5% market share in 2025, equivalent to US$ 894.00 million, and is projected to reach US$ 2,008.32 million by 2035.
- The Middle East & Africa peanut butter market was valued at US$ 458.35 million in 2025 and is projected to reach US$ 782.68 million by 2035, expanding at a CAGR of 5.6%.
- The Latin American peanut butter market was valued at US$ 620.58 million in 2025 and is anticipated to reach US$ 1,079.26 million by 2035, registering a CAGR of 5.8%.
Peanut Butter per Capita Consumption by Country
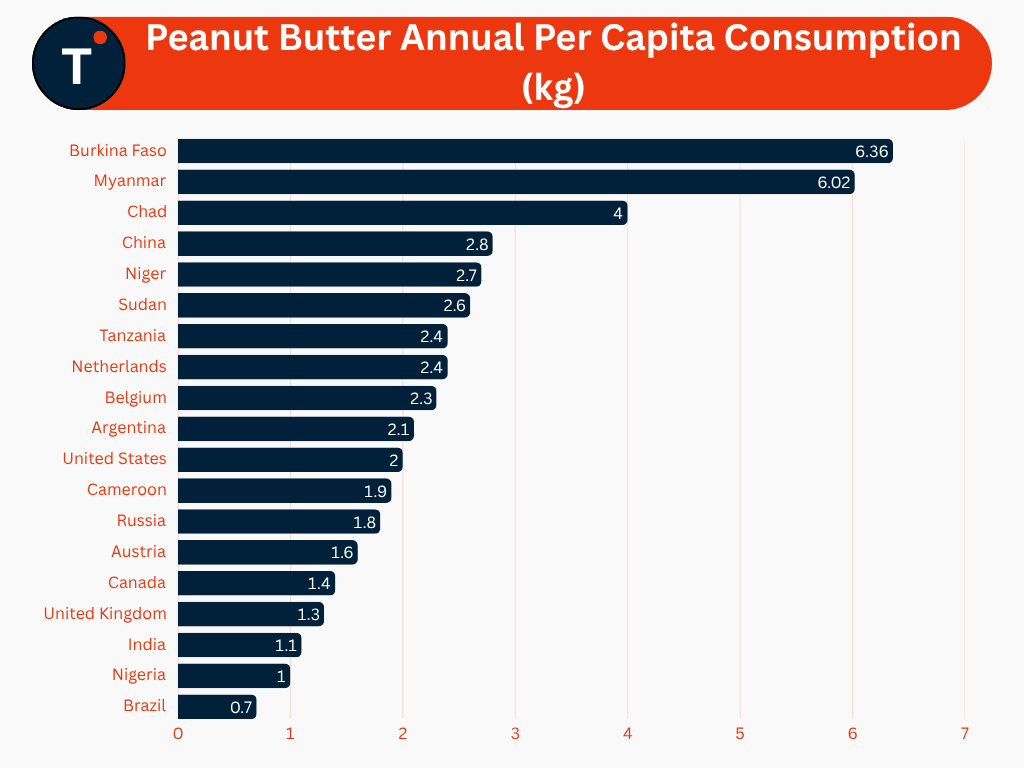
- Burkina Faso led the countries shown with annual per capita consumption of 6.36 kg.
- Myanmar followed with 6.02 kg per capita.
- Chad ranked third at 4.0 kg per capita.
- China reported 2.8 kg of annual per capita consumption.
- Niger reached 2.7 kg per capita.
- Sudan registered 2.6 kg per capita.
- Tanzania and the Netherlands each reached 2.4 kg per capita.
- Belgium recorded 2.3 kg per capita.
- Argentina reached 2.1 kg per capita.
- The United States reported 2.0 kg of annual per capita consumption.
- Cameroon reached 1.9 kg per capita.
- Russia registered 1.8 kg per capita.
- Austria reached 1.6 kg per capita.
- Canada reported 1.4 kg per capita.
- The United Kingdom reached 1.3 kg per capita.
- India recorded 1.1 kg per capita.
- Nigeria registered 1.0 kg per capita.
- Brazil had the lowest level among the countries shown, at 0.7 kg per capita.
How Much Peanut Butter Is Consumed in the United States??
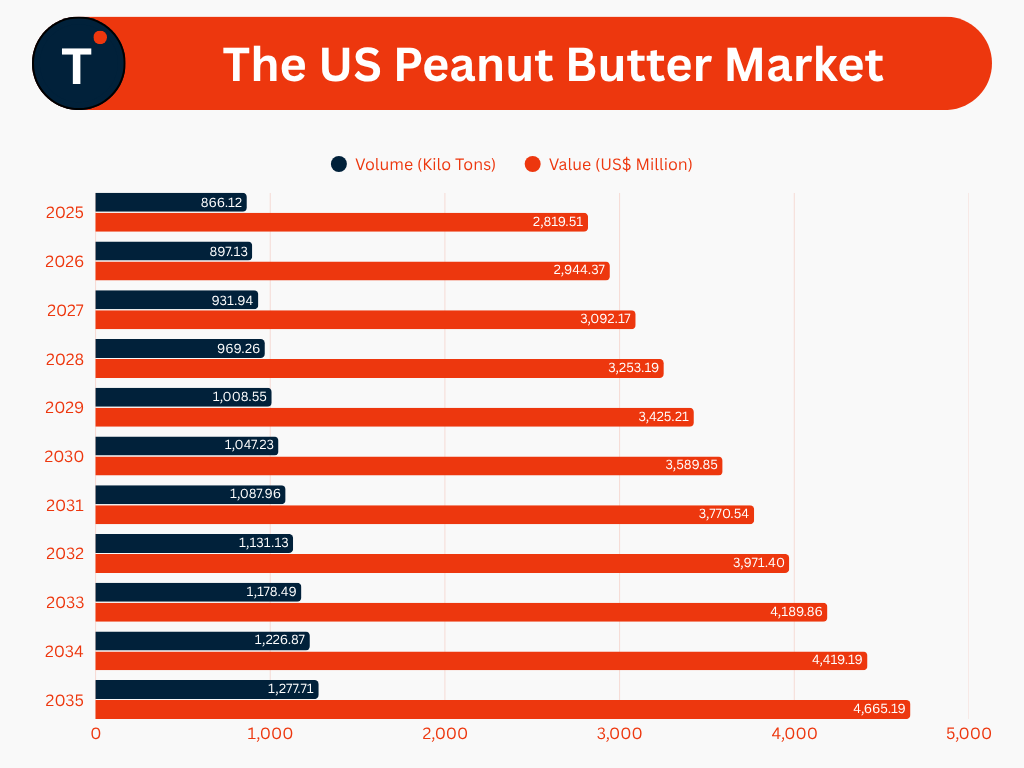
- The U.S. peanut butter market volume reached 866.12 kilotons in 2025 and is projected to reach 1,277.71 kilotons by 2035, expanding at a CAGR of 4.0%.
- In terms of market value, the U.S. peanut butter market was valued at US$ 2,819.51 million in 2025 and is projected to reach US$ 4,665.19 million by 2035, registering a CAGR of 5.2%.
Is Plain or Flavored Peanut Butter More Popular in the U.S.?
| Category | 2025 (US$ Million) | 2030 (US$ Million) | 2035 (US$ Million) |
| Plain/Original | 1,885.63 | 2,350.72 | 2,998.08 |
| Fruits | 127.57 | 165.55 | 217.82 |
| Chocolate | 609.39 | 814.01 | 1,102.40 |
| Others | 196.92 | 259.57 | 346.88 |
- Plain/original peanut butter dominated the U.S. market with a 66.9% share in 2025, making it the leading product type.
- Sales of plain/original peanut butter reached US$ 1,885.63 million in 2025 and are projected to expand at a CAGR of 4.8%, reaching US$ 2,998.08 million by 2035.
- Chocolate-flavored peanut butter is projected to be the fastest-growing segment, with a CAGR of 6.2% through 2035.
- Chocolate-flavored peanut butter accounted for 21.6% of U.S. sales in 2025, generating US$ 609.39 million, and is projected to reach US$ 1,102.40 million by 2035.
- Fruit-flavored peanut butter generated US$ 127.57 million in U.S. sales in 2025 and is projected to reach US$ 217.82 million by 2035, reflecting a CAGR of 5.6%.
Which Peanut Butter Type Leads the U.S. Market?
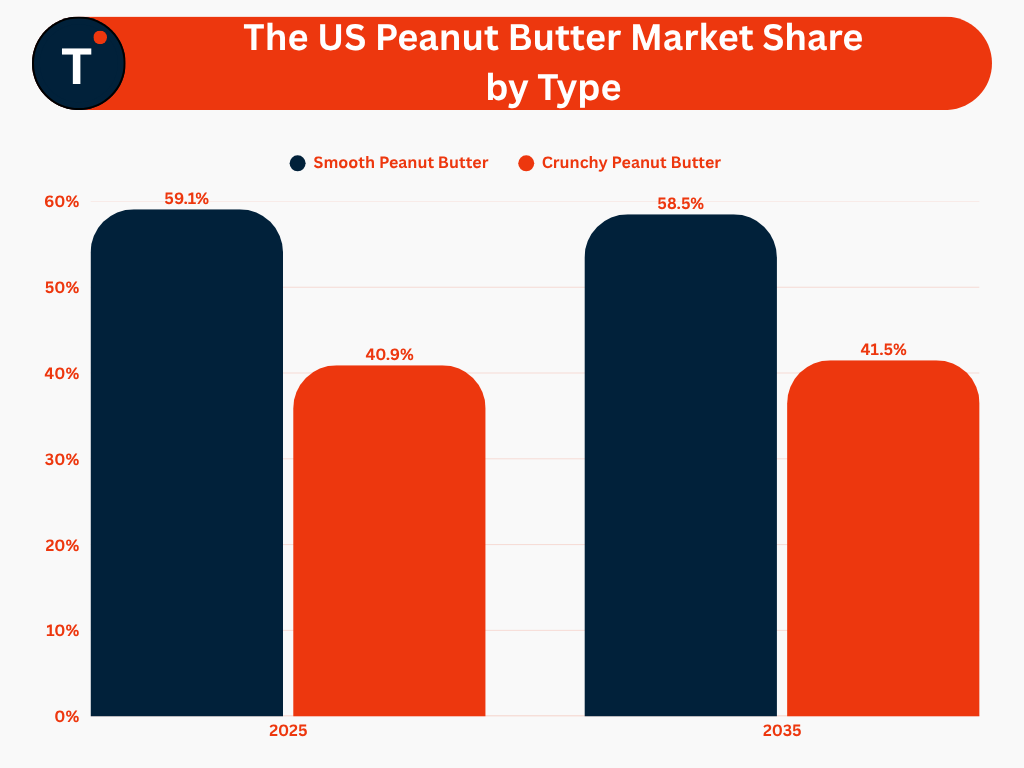
- Smooth peanut butter dominated the U.S. market with a 59.1% share in 2025, making it the leading product type.
- Sales of smooth peanut butter reached US$ 1,666.23 million in 2025 and are projected to reach US$ 2,730.30 million by 2035, expanding at a CAGR of 5.1%.
- Crunchy peanut butter accounted for 40.9% of total U.S. sales in 2025, representing the second-largest product type.
- Sales of crunchy peanut butter are projected to increase from US$ 1,153.28 million in 2025 to US$ 1,934.89 million by 2035, registering a CAGR of 5.5%.
How Is Peanut Butter Consumption Distributed Across Applications in the U.S.?
| Application | 2025 (Kilo Tons) | 2030 (Kilo Tons) | 2035 (Kilo Tons) |
| Snacks & Cookies | 143.74 | 179.55 | 224.79 |
| Desserts & Icecreams | 89.16 | 108.57 | 132.33 |
| Spreads & Dips | 590.62 | 710.71 | 864.98 |
| Others | 42.60 | 48.40 | 55.61 |
- Spreads & dips dominated U.S. peanut butter consumption with a 68.2% share in 2025, making it the leading application segment.
- Peanut butter consumption in spreads & dips reached 590.62 kilotons in 2025 and is projected to reach 864.98 kilotons by 2035, expanding at a CAGR of 3.9%.
- Peanut butter consumption in snacks & cookies stood at 143.74 kilotons in 2025 and is projected to reach 224.79 kilotons by 2035, registering a CAGR of 4.6%.
- The desserts & ice cream segment accounted for 89.16 kilotons of peanut butter consumption in 2025 and is projected to reach 132.33 kilotons by 2035, growing at a CAGR of 4.0%.
Where do Consumers Buy Peanut Butter in the US?
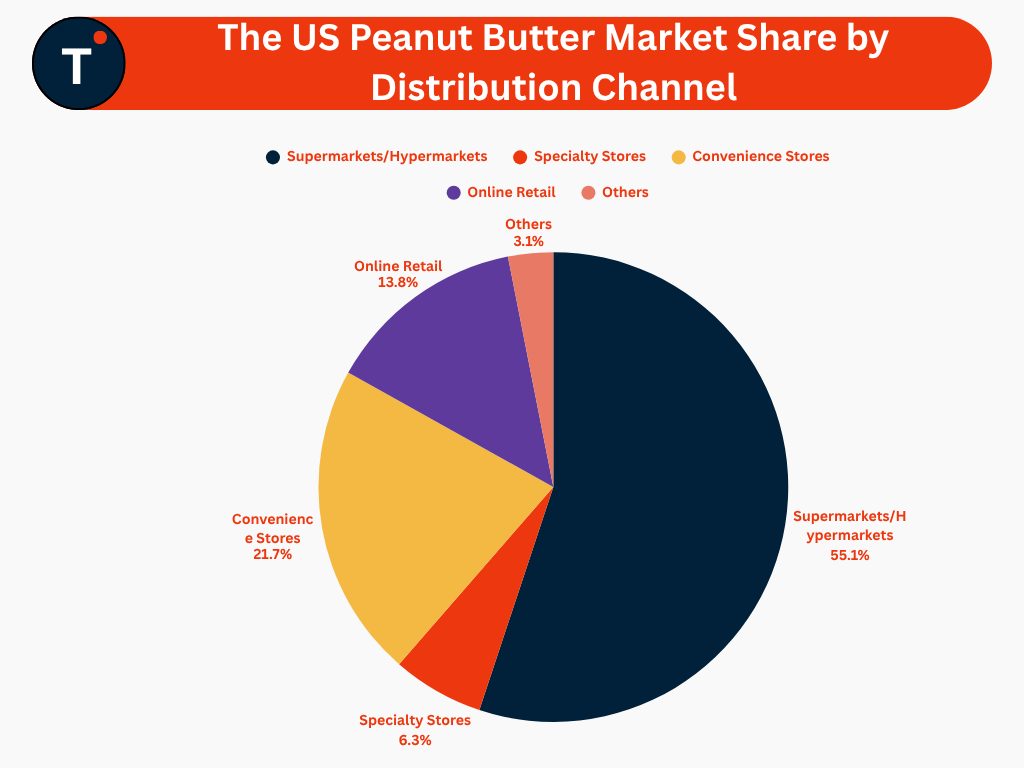
- Supermarkets/hypermarkets represented the largest distribution channel, with peanut butter sales of US$ 1,553.30 million in 2025. The segment is projected to reach US$ 2,605.43 million by 2035, expanding at a CAGR of 5.4%.
- Peanut butter sales through convenience stores totaled US$ 612.16 million in 2025 and are projected to reach US$ 940.81 million by 2035, registering a CAGR of 4.5%.
- Online retail is projected to be the fastest-growing distribution channel, with a CAGR of 6.3%, increasing from US$ 390.48 million in 2025 to US$ 714.06 million by 2035.
- Specialty store sales reached US$ 177.05 million in 2025 and are projected to reach US$ 276.44 million by 2035, growing at a CAGR of 4.6%.
Is Peanut Butter Good for You?
- A 2-tablespoon (32-gram) serving of natural peanut butter provides 190 calories, making it a nutrient-dense food option.
- The same serving contains 8 grams of protein, supporting its role as a protein-rich food.
- Peanut butter provides 16 grams of fat, along with 7 grams of carbohydrates.
- Each 32-gram serving contains 3 grams of fiber and 1 gram of sugar.
- Peanut butter is a source of several essential micronutrients, including vitamin E, niacin (vitamin B3), manganese, vitamin B6, and magnesium.
Canadian Peanut Butter Consumption Statistics
- 94% of Canadian households consume peanut butter at least once every few months, indicating widespread household penetration.
- 60% of households consume peanut butter at least once per week, highlighting its regular presence in Canadian diets.
- 85% of households keep peanut butter on hand, while 77% consider it a pantry staple.
- 90% of Canadians consider peanuts and peanut butter healthy or nutritious, supporting their positive nutritional perception.
- 83% of Canadians consider peanut butter satisfying for hunger, compared with 80% for peanuts.
- 64% of Canadians regularly snack on peanuts, making them the second-most preferred snack food after chips.
- 42% frequently use peanut butter as an ingredient in meals, while 26% frequently incorporate peanuts into meals.
Which Peanut Butter Brands Are Most Popular Among U.S. Consumers?
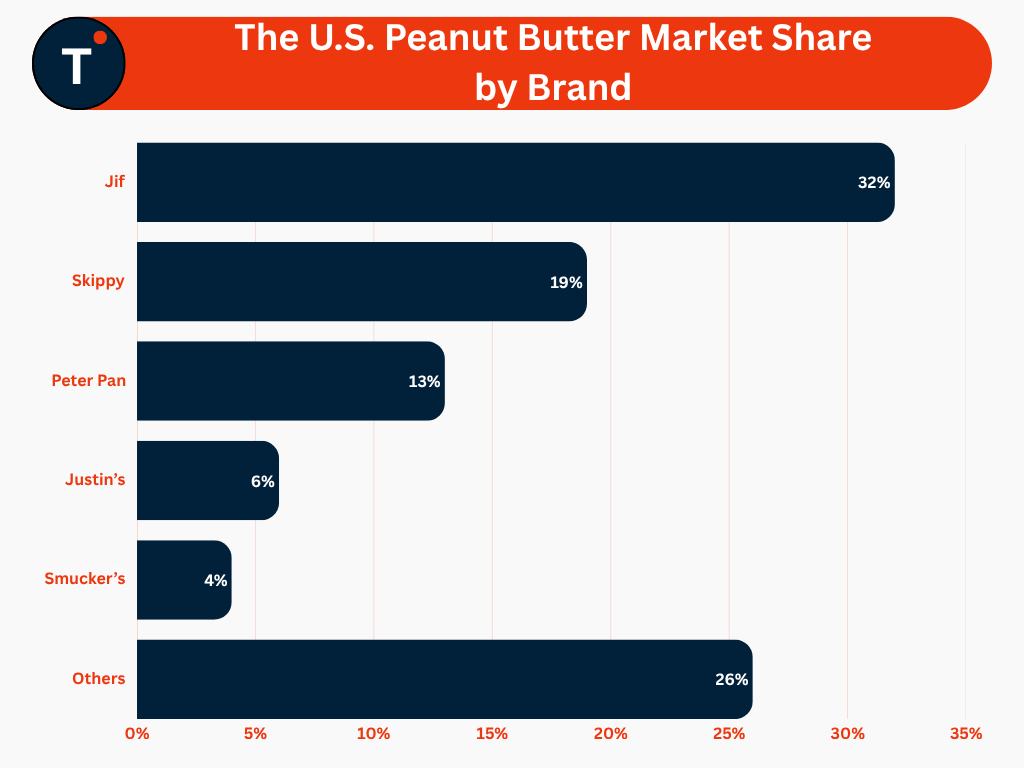
- Jif held the largest share of the U.S. peanut butter market at 32%, maintaining a clear lead among the major brands.
- Skippy accounted for 19% of the market, ranking as the second-largest brand.
- Peter Pan held a 13% market share, positioning it as the third-largest brand.
- Justin’s accounted for 6% of the U.S. peanut butter market, followed by Smucker’s with 4%.
- The leading 5 brands collectively represented 74% of the market, indicating a concentrated competitive landscape.
Recent Developments in the Peanut Butter Market
- In August 2026, Jif introduced updated branding, marking the first major visual identity refresh for the brand in more than 30 years and reinforcing its position as a leading peanut butter brand in the U.S.
- In April 2026, Ferrero North America opened a new Nutella Peanut production line in Franklin Park, Illinois, following a US$75 million investment. The facility is expected to create 50 new jobs and represents the Nutella brand’s first new flavor and first product manufactured in the United States.
- In October 2025, Hormel Foods Corporation and Forward Consumer Partners announced a strategic partnership for the JUSTIN’S brand. Under the agreement, JUSTIN’S, which includes nut butters and USDA-certified organic chocolate products, became a standalone company with Forward Consumer Partners holding a 51% stake and Hormel Foods retaining 49%.
- In September 2025, Natra and Bredabest formed a strategic partnership to strengthen their positions in sweet spreads and confectionery. The collaboration combines Natra’s chocolate expertise with Bredabest’s capabilities in peanut butter and peanut-based ingredients to expand offerings across Europe and international markets.
Conclusion
- The peanut butter market is positioned for steady long-term growth, supported by increasing demand for nutritious, convenient, and versatile food products.
- Strong consumer acceptance in the United States continues to provide a solid foundation for the market, while adoption across emerging markets is creating additional growth opportunities.
- Growing interest in natural, plant-based, protein-rich, and diet-friendly foods is encouraging manufacturers to diversify product offerings and respond to evolving consumer preferences.
- Product innovation and technological advancements are strengthening the market by improving taste, texture, nutritional attributes, shelf life, and product variety.
- Expanding online retail and changing purchasing habits are creating new opportunities for brands to reach consumers and broaden market accessibility.
- Increasing use of peanut butter across everyday foods, snacks, sports nutrition, and other food applications is supporting its position as a versatile and widely accepted food product.