






Organizations are increasingly recognizing workplace food programs as a strategic employee benefit, with growing demand for greater meal variety, flexibility, and opportunities for workplace engagement. As hybrid and on-site work models continue to evolve, food offerings have become an integral component of employee experience, supporting talent attraction, retention, and collaboration. Beyond conventional catering services, employers are expanding meal solutions through grab-and-go options, recurring employee meal programs, and restaurant pop-up initiatives to align with changing workforce preferences.
Editor’s Picks
- 23.4% of working adults obtained food at the workplace during a typical week, with workplace food consumption averaging 1,292 kcal per person per week.
- Employees consumed an additional 1,300 calories at work on average, with the majority of these calories coming from complimentary food provided by employers.
- Free food accounted for 17% of workplace food consumption, compared with 8% from purchased meals, making it the most common source of food at work.
- 88% of business leaders reported that providing workplace meals encourages employees to work on-site, while 67% of hybrid employees stated that free food increases their willingness to attend the office.
- 78% of workplace food program decision-makers indicated that food benefits improve employee retention, representing a 13% increase compared with 2023.
- Two-thirds of employees spent at least USD 10 on lunch, resulting in an average annual workplace food expenditure of USD 2,500 for full-time, office-based employees.
- 65% of employees reported consuming snacks as meal replacements during the workday.
- 18% of employees relied on vending machines or convenience stores for workplace meals or snacks.
- The U.S. workforce comprises more than 163 million employed adults, highlighting the growing importance of workplace nutrition and wellness initiatives.
- According to the National Center for Health Statistics (NCHS), over 60% of the workforce is affected by weight-related health conditions.
- 67% of professionals responsible for managing cafeterias in hybrid workplaces identified increasing office attendance as their primary objective.
- 75% of corporate dining decision-makers stated that workplace dining programs require modernization or significant redesign.
- 29% of employees stopped using their company’s cafeteria due to rising meal costs.
- 42% of employees with access to on-site dining expressed a preference for healthier food options, reflecting a 15% increase from the previous year.
- According to the World Economic Forum, organizations implementing comprehensive employee wellbeing programs that include nutrition achieved 3.27 times higher shareholder returns over a 15-year period.
General Statistics
- 58% of the global population is expected to spend nearly one-third of adult life in the workplace, emphasizing the growing influence of workplace nutrition on overall health and wellbeing.
- Most Americans spend approximately half of their waking hours at work, with a significant share of their daily food intake coming from meals acquired in the workplace.
- Although 97% of Americans recognize breakfast as the most important meal of the day, only 44% consume breakfast daily.
- Employees with unhealthy dietary habits were 66% more likely to experience productivity losses than those maintaining healthier eating patterns.
- Employees who rarely consumed fruits, vegetables, and other low-fat foods at work were 93% more likely to report reduced productivity.
- Health-related productivity losses accounted for 77% of total employee productivity declines, costing employers 2–3 times more than annual healthcare expenditures.
- Employees who faced challenges in exercising during the workday were 96% more likely to experience higher productivity losses.
- Smokers were 28% more likely to report reduced workplace productivity compared to non-smokers.
- Employees aged 30–40 years were the most likely to report productivity declines, whereas those aged 60 years and older reported the lowest incidence of productivity loss.
- Employers incurred significantly higher healthcare expenditures, with annual medical costs for individuals with obesity ranging from USD 1,429 to USD 2,741 more than those for individuals with a healthy weight.
- According to the U.S. Department of Agriculture (USDA), healthier dietary patterns could prevent at least USD 71 billion annually in medical expenses, productivity losses, and premature deaths.
- Workplace health promotion initiatives focused on improving dietary habits have been shown to increase productivity by 2% to 20%.
- While approximately one-third of businesses adopted hybrid work models in 2024, more than 90% of employees continued to work on-site for at least two days per week.
- Among employers investing in workplace food programs to encourage in-office collaboration, 88% reported that attendance increased by at least 50% when meals were provided.
- Employer-sponsored meal programs saved employees 30 minutes during the workday on average, contributing to greater workplace efficiency.
- 87% of business leaders rated workplace cafeteria food as good or excellent, whereas only 48% of employees shared the same opinion, representing a 12% year-over-year decline in employee satisfaction.
Workplace Eating Habits Statistics
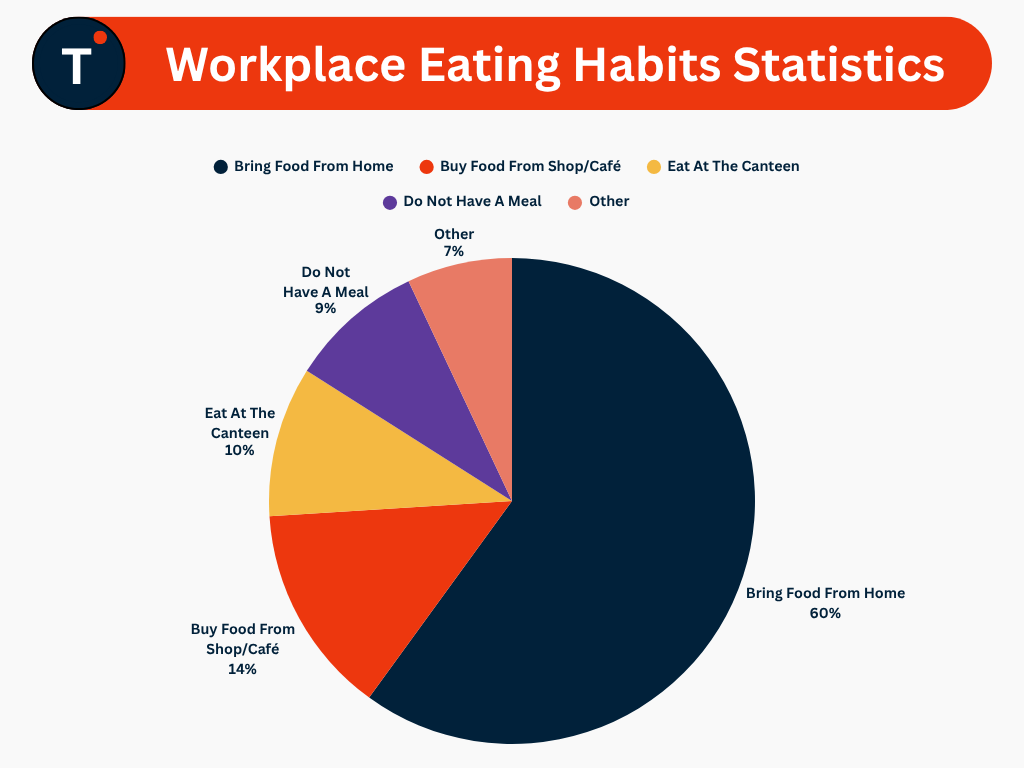
- 60% of employees brought food from home, making it the most preferred workplace meal option.
- 14% of employees purchased food from shops or cafés during the workday.
- 10% of employees chose to eat at the workplace canteen.
- 9% of employees did not consume a meal during the workday.
Most Common Office Snacks Offered to US Employees
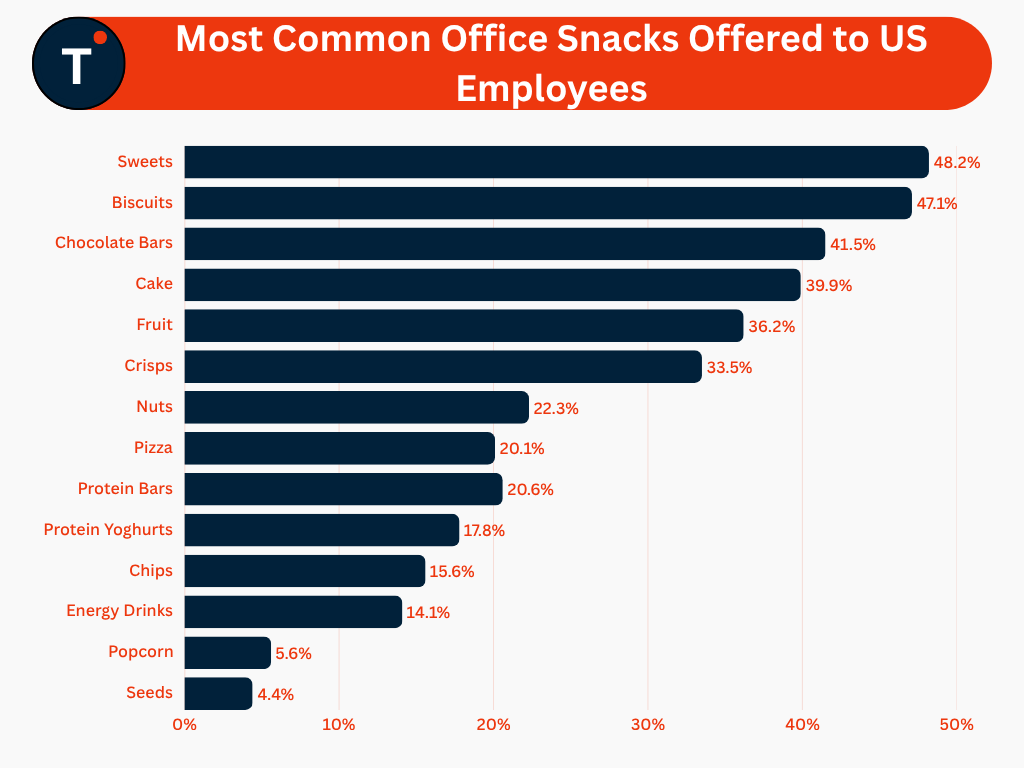
- 48.2% of workplace snack offerings consist of sweets, making them the most commonly available office snack.
- 47.1% of workplace snack offerings include biscuits, ranking second among the most common office snacks.
- 41.5% of office snack selections comprise chocolate bars.
- 39.9% of workplace snack offerings include cake.
- 36.2% of available office snacks consist of fruit, highlighting the growing presence of healthier snack options.
- 33.5% of workplace snack offerings include crisps.
- 22.3% of office snack selections consist of nuts, making them one of the leading nutritious snack options.
- 20.6% of workplace snack offerings include protein bars.
- 20.1% of office snack selections consist of pizza.
- 17.8% of workplace snack offerings include protein yoghurts.
- 15.6% of office snack selections comprise chips.
- 14.1% of workplace refreshments include energy drinks.
- 5.6% of office snack offerings consist of popcorn.
- 4.4% of workplace snack offerings include seeds, making them the least common snack option.
Most Valued Workplace Benefits Among Employees
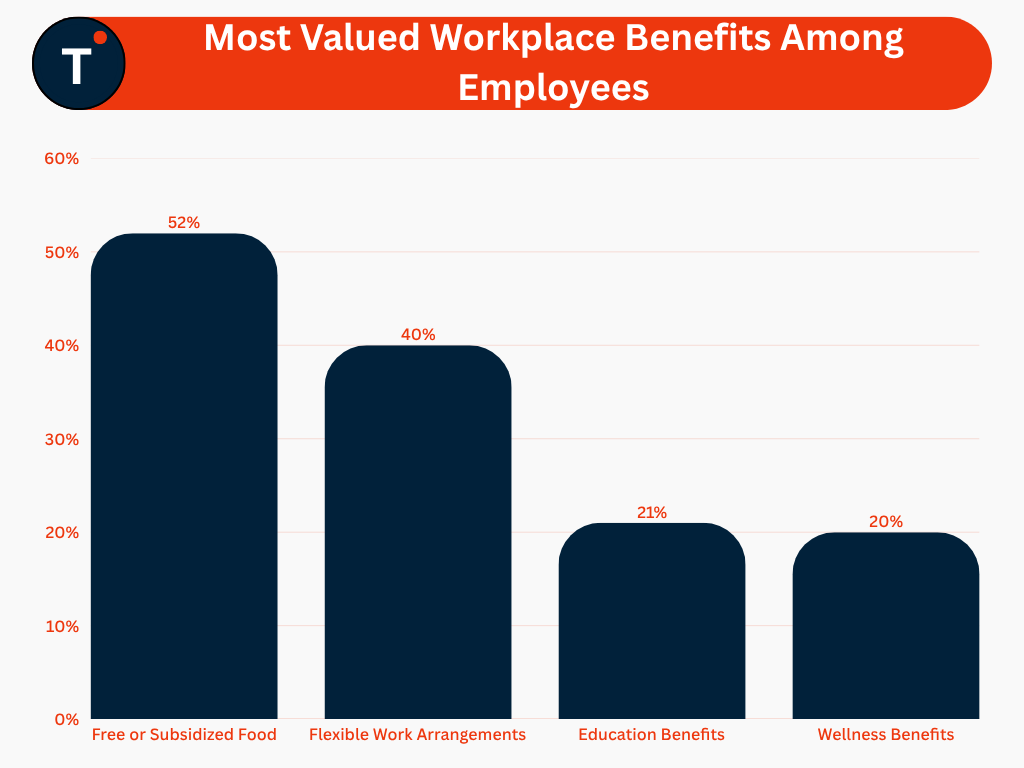
- Free or subsidized food ranks as the most valued workplace benefit, preferred by 52% of employees.
- Flexible work arrangements rank second among workplace benefits, with a preference share of 40%.
- Education benefits account for 21% of the most appreciated employee benefits.
- Wellness benefits represent 20% of preferred workplace perks, reflecting continued emphasis on employee health and well-being.
Use of Food Perks for Employee Recruitment
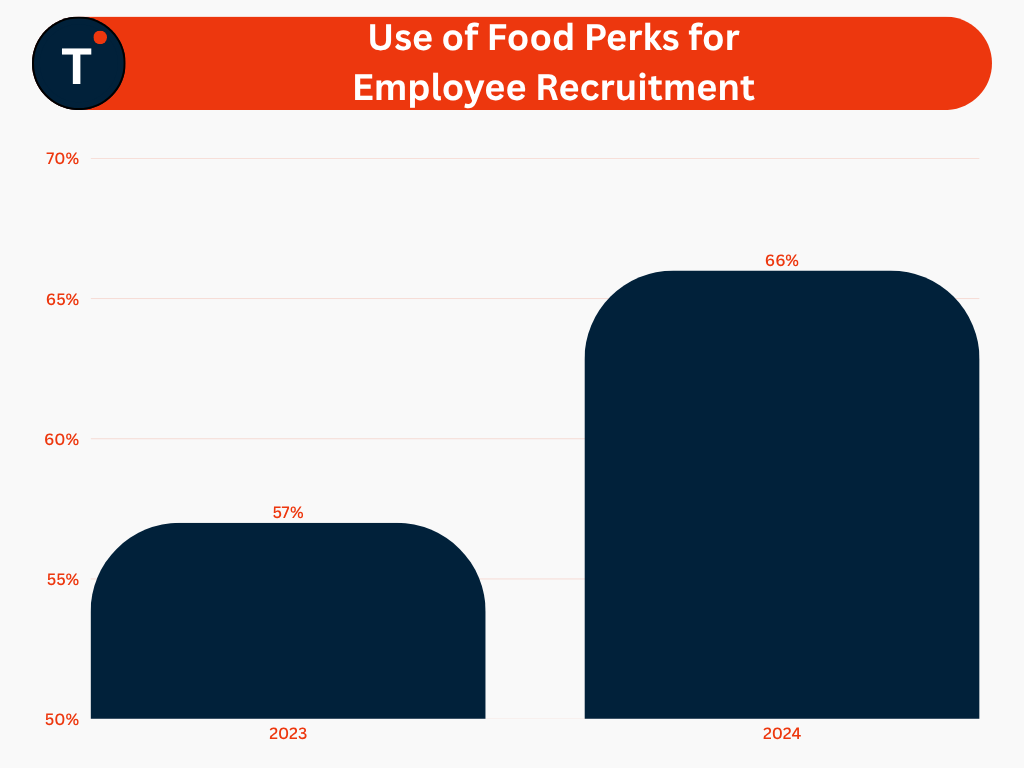
- The adoption of food perks for recruitment purposes increased from 57% in 2023 to 66% in 2024.
- The share of organizations utilizing food benefits as a talent acquisition strategy grew by 9 percentage points between 2023 and 2024.
Key Benefits of Free Workplace Meals
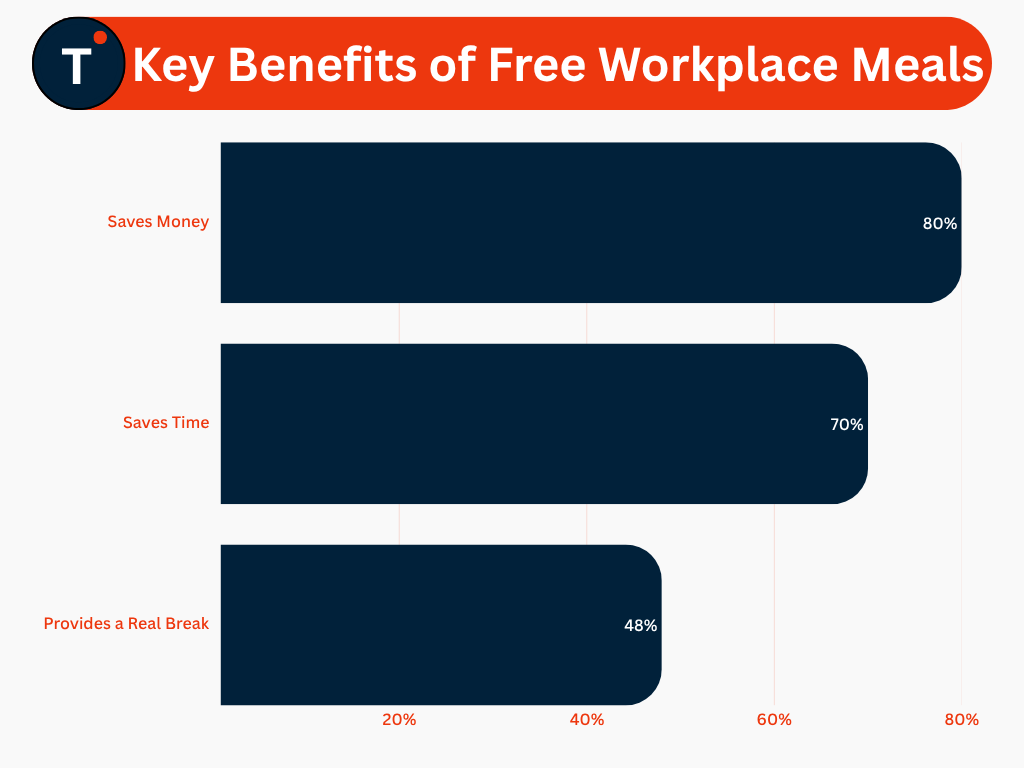
- 80% of the value associated with free workplace meals is attributed to cost savings, making it the leading benefit.
- 70% of the perceived benefits of employer-provided meals are linked to time savings during the workday.
- 48% of the value of free workplace meals is associated with providing employees with a meaningful break from work.
Average Lunch Break Duration
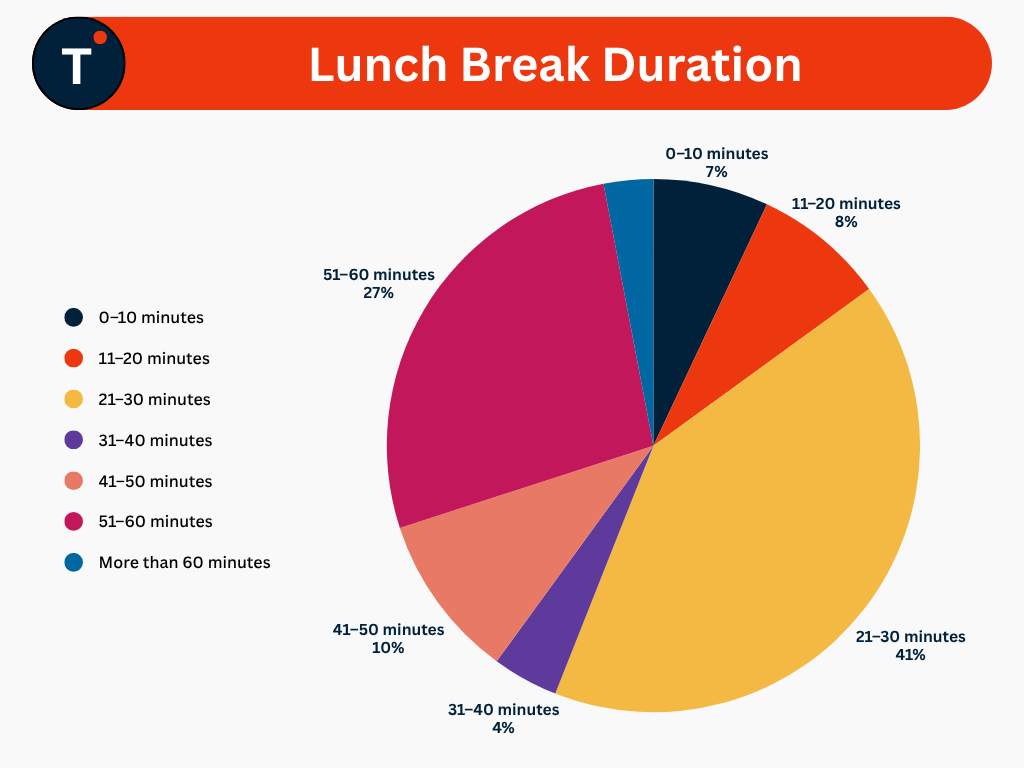
- 41% of lunch breaks last 21–30 minutes, making it the most common lunch break duration.
- 27% of lunch breaks extend between 51–60 minutes, representing the second-largest share.
- 10% of lunch breaks fall within the 41–50 minute range.
- 8% of lunch breaks last 11–20 minutes.
- 7% of lunch breaks are limited to 0–10 minutes.
- 4% of lunch breaks last 31–40 minutes.
- 3% of lunch breaks exceed 60 minutes, representing the smallest share of lunch break durations.
Average Lunch Break Duration by Industry
- The government sector records the longest average lunch break at 38.2 minutes.
- Finance and insurance follows with an average lunch break duration of 37.8 minutes.
- Professional services averages 36.9 minutes per lunch break.
- Telecommunications records an average lunch break duration of 36.7 minutes.
- Engineering employees take an average lunch break of 34.9 minutes.
- Transportation averages 34.8 minutes for lunch breaks.
- Science and research records an average lunch break duration of 34.0 minutes.
- Media, entertainment, and arts averages 33.8 minutes.
- Technology and information records an average lunch break of 33.2 minutes.
- Education and training averages 32.9 minutes.
- Manufacturing records an average lunch break duration of 32.5 minutes.
- Healthcare averages 30.9 minutes.
- Retail records an average lunch break duration of 30.8 minutes.
- Hospitality and tourism averages 30.6 minutes.
- Nonprofit organizations also record an average lunch break duration of 30.6 minutes.
- Construction averages 29.8 minutes.
- Shipping and warehousing records an average lunch break duration of 28.5 minutes.
- Energy, utilities, and environment averages 27.4 minutes.
- Food services records the shortest average lunch break at 25.2 minutes.
Employees Working During Lunch by Occupation
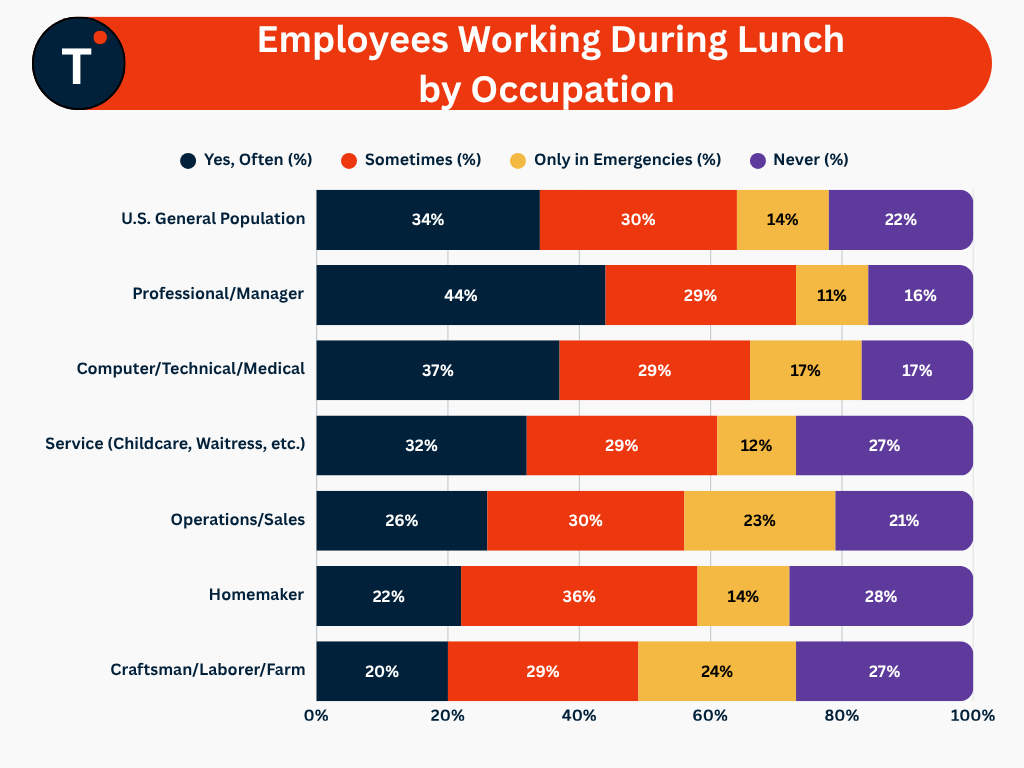
- 44% of professionals and managers work during lunch often, the highest among the listed occupations.
- 37% of employees in computer, technical, and medical occupations work during lunch often.
- 34% of the U.S. general population works during lunch often.
- 32% of service workers work during lunch often.
- 26% of employees in operations and sales work during lunch often.
- 22% of homemakers work during lunch often.
- 20% of craftsmen, laborers, and farm workers work during lunch often, the lowest among the listed occupations.
- 36% of homemakers work during lunch sometimes, the highest share across occupations.
- 30% of employees in operations and sales work during lunch sometimes.
- 30% of the U.S. general population works during lunch sometimes.
- 29% of professionals and managers work during lunch sometimes.
- 29% of employees in computer, technical, and medical occupations work during lunch sometimes.
- 29% of service workers work during lunch sometimes.
- 29% of craftsmen, laborers, and farm workers work during lunch sometimes.
- 24% of craftsmen, laborers, and farm workers work during lunch only in emergencies, the highest among the listed occupations.
- 23% of employees in operations and sales work during lunch only in emergencies.
- 17% of employees in computer, technical, and medical occupations work during lunch only in emergencies.
- 14% of the U.S. general population and homemakers work during lunch only in emergencies.
- 12% of service workers work during lunch only in emergencies.
- 11% of professionals and managers work during lunch only in emergencies, the lowest among the listed occupations.
- 28% of homemakers never work while eating lunch, the highest share across occupations.
- 27% of service workers and craftsmen, laborers, and farm workers never work during lunch.
- 22% of the U.S. general population never works while eating lunch.
- 21% of employees in operations and sales never work during lunch.
- 17% of employees in computer, technical, and medical occupations never work during lunch.
- 16% of professionals and managers never work while eating lunch, the lowest among the listed occupations.
Meal Ordering Patterns by Time of Day
- AI startups record the highest meal ordering activity at 5:00 PM (24.0%).
- All other industries reach peak meal ordering at 12:00 PM (18.3%).
- 16.8% of meal orders in AI startups are placed at 4:00 PM, indicating a strong late-afternoon preference.
- 12.6% of AI startup meal orders occur at 6:00 PM.
- 10.8% of AI startup orders are placed at 11:00 AM.
- 17.1% of meal orders across other industries are placed at 11:00 AM, followed by 18.3% at 12:00 PM.
- Meal ordering activity across other industries declines after 12:00 PM, with 10.0% recorded at 6:00 PM.
- Evening meal orders remain more prominent in AI startups than in other industries, particularly between 4:00 PM and 6:00 PM.
Emerging Workplace Food Program Trends
- 25% of workplace food programs include special breakfast offerings.
- 24% incorporate food trucks as part of employee meal services.
- 21% provide fresh fruits and produce to support healthier food choices.
- 19% feature grab-and-go meals for greater convenience.
- 18% include restaurant pop-ups within workplace dining programs.
- 17% offer recurring employee meal programs.
Conclusion
- Workplace food and dining programs have become an integral component of the modern employee experience, influencing workplace wellness, productivity, collaboration, and talent management.
- The trends highlight increasing employer investment in food benefits, healthier meal options, and flexible dining programs to align with evolving workforce expectations.
- Workplace eating habits, lunch break durations, snack preferences, and meal ordering patterns continue to vary across industries, occupations, and work environments, reflecting diverse employee behaviors and operational requirements.
- The growing integration of workplace nutrition initiatives underscores the strategic role of food programs in enhancing employee satisfaction, supporting organizational performance, and fostering a healthier workplace culture.
Add TriCityLocalNews as a Preferred Source on Google for instant updates!