
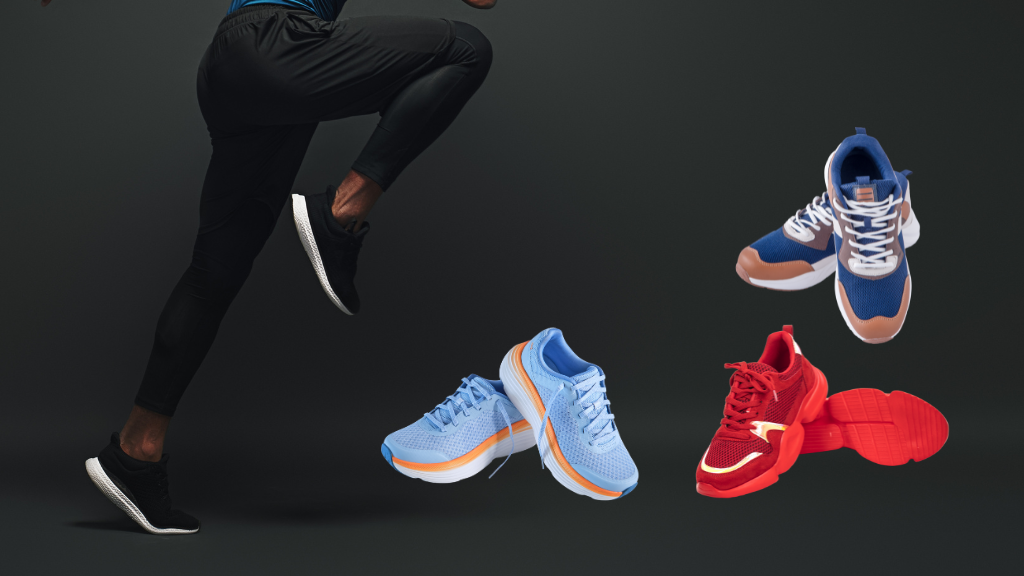







Running shoes have evolved into advanced performance footwear designed to enhance comfort, stability, cushioning, and overall running efficiency. Continuous innovations in materials, sole technologies, and biomechanical design have transformed running shoes into essential equipment for professional athletes, fitness enthusiasts, and recreational runners alike.
The sustained growth of running as a fitness and recreational activity has driven strong demand for technologically advanced footwear across global markets. Manufacturers continue to invest in product innovation, lightweight construction, enhanced energy return, and sustainability initiatives to meet evolving consumer preferences while strengthening competition within the global running shoes industry.
Editor’s Choice
- The global running shoes market was valued at US$50.14 billion in 2025, reflecting strong consumer demand for performance footwear.
- Global running shoe sales are projected to reach US$52.84 billion in 2026.
- The worldwide running shoes market is forecast to attain a value of US$89.91 billion by 2035.
- The U.S. running shoes market is projected to reach US$19.17 billion by 2030.
- The U.S. running shoes market is expected to expand at a CAGR of 5.9% during the forecast period.
- A total of 52.3 million Americans participated in running or jogging activities in 2025, marking the second consecutive year of record participation.
- Runners purchase an average of three pairs of running shoes annually, reflecting regular replacement cycles driven by performance and durability requirements.
- Trail running shoes are priced 3.3% higher than road running shoes on average.
- 18.7% of running shoes have a manufacturer’s suggested retail price (MSRP) below US$100.
- 7.2% of running shoes are priced at an MSRP of US$200 or higher, representing the premium segment of the market.
- Road running shoes feature an average heel-to-toe drop of 8.4 mm, compared with 7.0 mm for trail running shoes.
- The average heel stack height is 28.7 mm for road running shoes, while trail running shoes average 26.9 mm.
- The average forefoot stack height measures 20.8 mm in road running shoes and 20.9 mm in trail running shoes.
- Carbon plate technology is incorporated in 5.8% of running shoes, while 3.2% feature a Gore-Tex membrane for enhanced weather resistance.
- Slip-on designs account for 3.8% of running shoes available in the market.
General Statistics
- The United States had 6,750 athletic shoe stores in 2025, with the industry expanding at a CAGR of 8.1% between 2020 and 2025.
- Americans spend an average of US$735 annually on footwear, reflecting strong consumer expenditure on shoes across categories.
- Runners allocate an average of US$354.10 per year to running footwear, highlighting consistent demand for performance-oriented shoes.
- Global footwear production exceeds 24 billion pairs annually, equivalent to more than 60 million pairs manufactured each day.
- Global athletic footwear sales volume increased from 4.57 billion pairs in 2021 to 5.30 billion pairs in 2025, demonstrating sustained market growth.
- Modern running shoes combine high-energy-return foams, such as Pebax and ZoomX, with rigid carbon fiber plates, enabling up to 85% energy recovery from impact, compared with 65% for conventional foam technologies.
- China hosted 749 road races across multiple competition levels in 2024, attracting more than 7.04 million participants, reflecting the growing popularity of marathon and road-running events.
- 54% of runners participated in competitive running events in 2025, with participation rates highest among younger generations, including 69% of Gen Z, 60% of Millennials, 40% of Gen X, and 25% of Baby Boomers.
- 65% of runners reported feeling unsafe while running in 2025, representing a 23% year-over-year increase.
- Women reported higher levels of safety concerns than men, with 72% of women and 60% of men indicating they had felt unsafe while running.
- Gen Z runners recorded the highest level of safety concerns, with 83% reporting that they had experienced feelings of being unsafe while running.
- 62% of runners reported experiencing intimidation while running, highlighting ongoing safety challenges within the running community.
- Women are more likely to experience intimidation than men, with 67% of women reporting such incidents compared with 58% of men, while catcalling remains one of the most commonly reported forms of harassment affecting female runners.
Global Running Shoes Market Insights
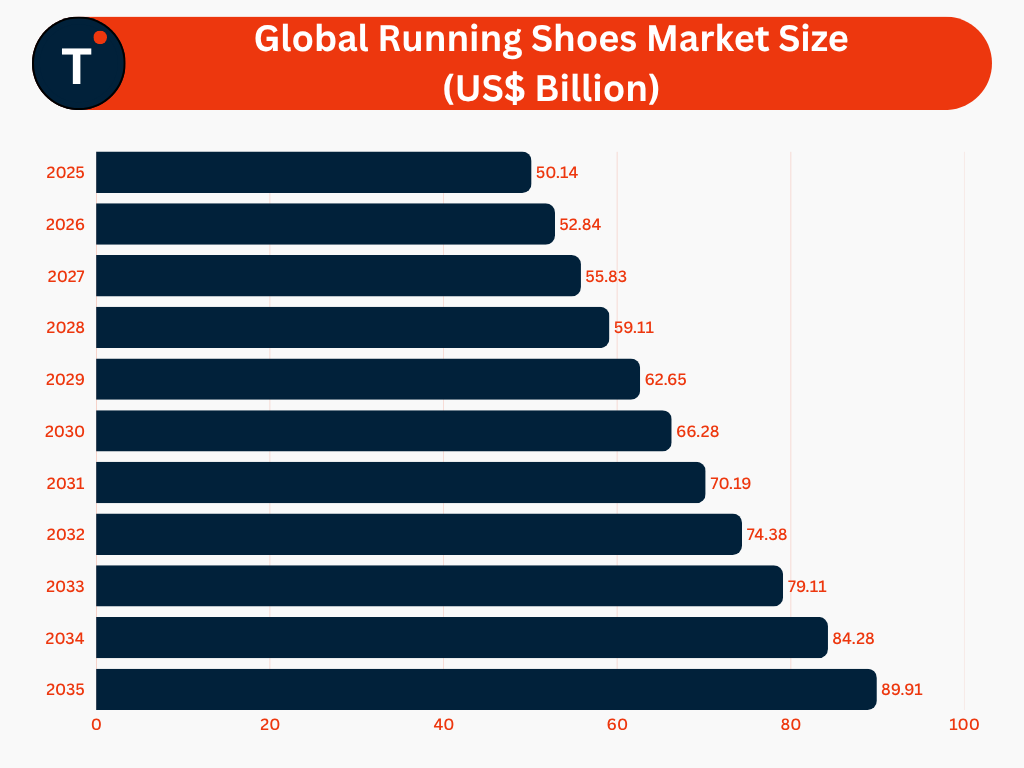
- The global running shoes market was valued at US$50.14 billion in 2025 and is projected to reach US$89.91 billion by 2035, expanding at a CAGR of 6.1%.
- North America dominated the global running shoes market, accounting for 33.9% of total revenue in 2025.
- The North America running shoes market generated US$17.01 billion in revenue in 2025 and is forecast to reach US$29.78 billion by 2035, registering a CAGR of 5.8%.
- Europe accounted for 27.5% of the global running shoes market in 2025, making it the second-largest regional market.
- The Europe running shoes market was valued at US$13.81 billion in 2025 and is anticipated to reach US$24.05 billion by 2035, growing at a CAGR of 5.7%.
- Asia Pacific is projected to be the fastest-growing regional market, expanding at a CAGR of 7.1% during the forecast period.
- The Asia Pacific running shoes market is expected to increase from US$13.17 billion in 2025 to US$25.73 billion by 2035.
- The Middle East & Africa running shoes market was valued at US$2.92 billion in 2025 and is projected to reach US$5.00 billion by 2035, reflecting a CAGR of 5.5%.
- The Latin America running shoes market was valued at US$3.23 billion in 2025 and is projected to reach US$5.35 billion by 2035, expanding at a CAGR of 5.2%.
The U.S. Running Shoes Market Insights
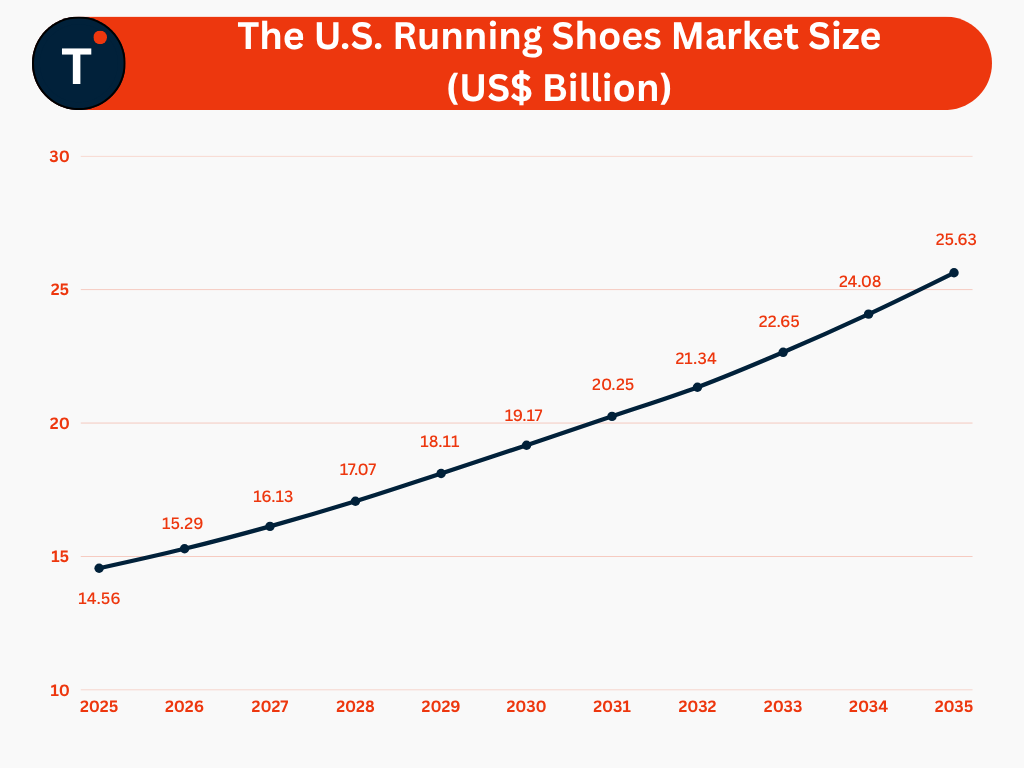
- The U.S. running shoes market was valued at US$14.56 billion in 2025.
- The U.S. running shoes market is projected to reach US$15.29 billion in 2026, reflecting continued growth in consumer demand for running footwear.
- The market is expected to expand at a CAGR of 5.9% during the 2026–2035 forecast period.
- The U.S. running shoes market is forecast to attain a value of US$25.63 billion by 2035.
Global Running Shoes Market by Age Group
| Age Group | 2025 | 2030 | 2035 |
| Up to 18 Years | 7.98 | 10.56 | 14.16 |
| 19 to 29 Years | 15.71 | 21.01 | 28.54 |
| 30 to 39 Years | 13.50 | 18.18 | 25.89 |
| 40 to 49 Years | 8.20 | 10.56 | 13.74 |
| Above 50 Years | 4.75 | 5.97 | 7.58 |
- The 19–29 years age group dominated the global running shoes market, accounting for 31.3% of total revenue in 2025.
- The 19–29 years segment was valued at US$15.71 billion in 2025 and is projected to reach US$28.54 billion by 2035, expanding at a CAGR of 6.2%.
- The 30–39 years age group accounted for 26.9% of the global running shoes market in 2025, making it the second-largest segment.
- The 30–39 years segment is projected to register the fastest growth, expanding at a CAGR of 6.9% from US$13.50 billion in 2025 to US$25.89 billion by 2035.
- The 40–49 years age group represented 16.4% of the global running shoes market in 2025.
- The 40–49 years segment generated US$8.20 billion in revenue in 2025 and is forecast to reach US$13.74 billion by 2035, growing at a CAGR of 5.3%.
- Consumers aged up to 18 years accounted for 15.9% of the global running shoes market in 2025.
- The up to 18 years segment was valued at US$7.98 billion in 2025 and is expected to reach US$14.16 billion by 2035, registering a CAGR of 5.9%.
- The above 50 years age group accounted for 9.5% of the global running shoes market in 2025.
- The above 50 years segment generated US$4.75 billion in revenue in 2025 and is projected to reach US$7.58 billion by 2035, expanding at a CAGR of 4.8%.
Global Running Shoes Market by End-user
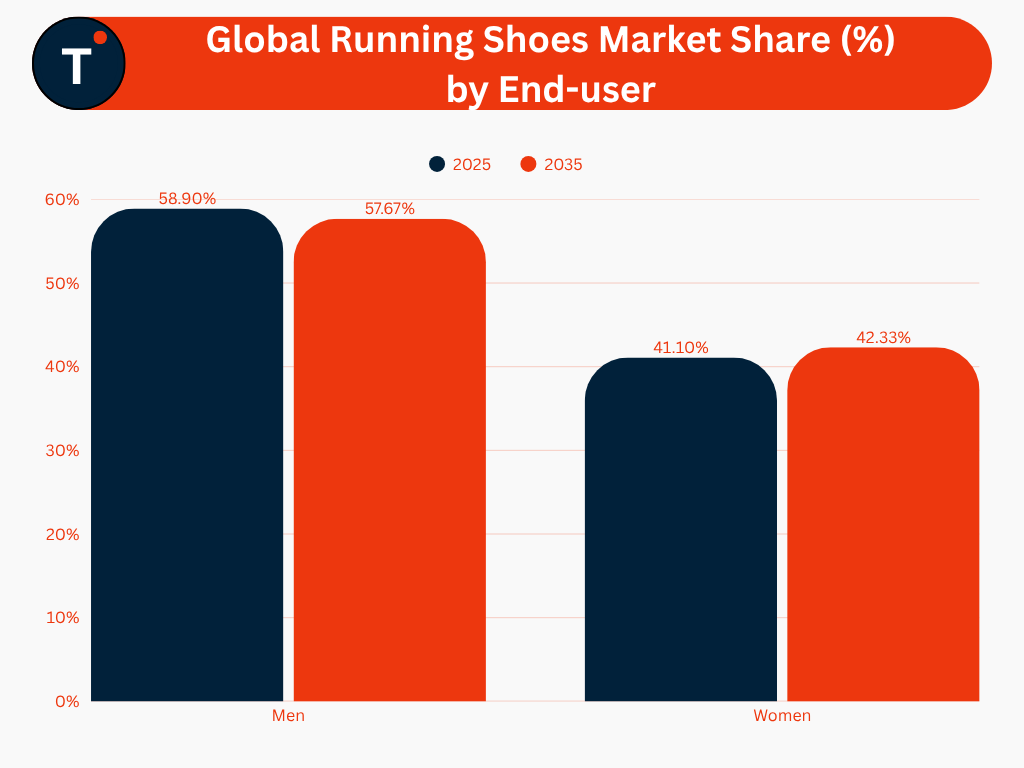
- Men dominated the global running shoes market, accounting for 58.9% of total revenue in 2025.
- The men’s running shoes segment was valued at US$29.53 billion in 2025 and is projected to reach US$51.85 billion by 2035, expanding at a CAGR of 5.8%.
- Women accounted for 41.1% of the global running shoes market in 2025.
- The women’s running shoes segment is projected to register the fastest growth, with a CAGR of 6.5% during the forecast period.
- The women’s running shoes market is expected to increase from US$20.61 billion in 2025 to US$38.06 billion by 2035.
Global Running Shoes Market by Distribution Channel
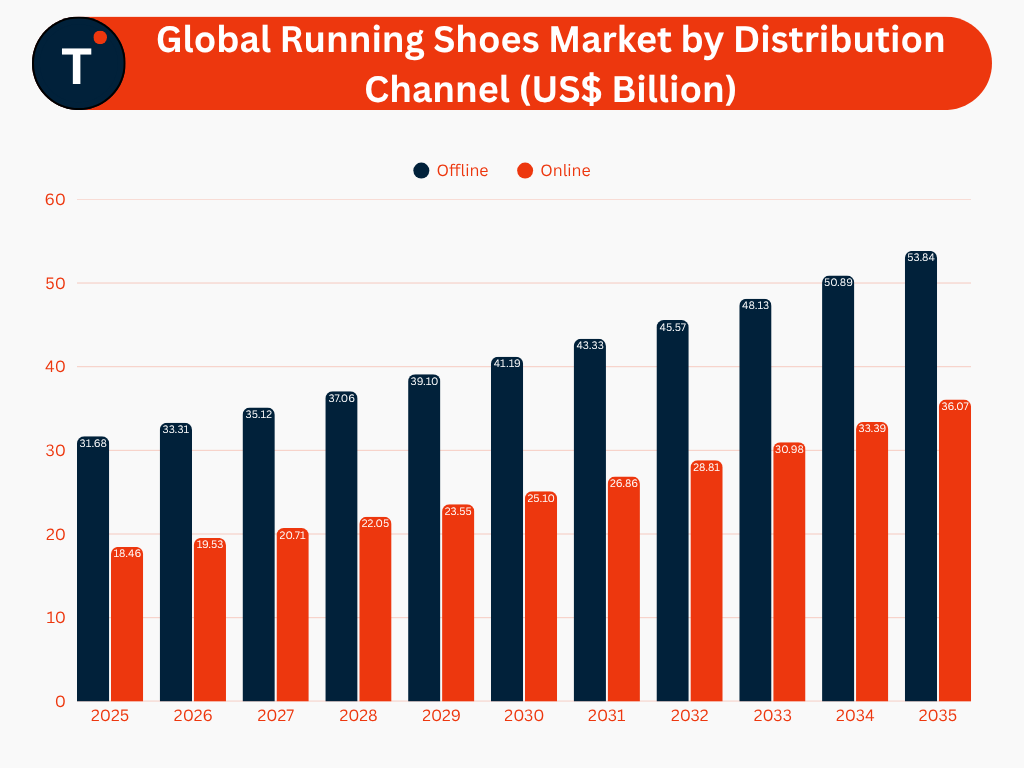
- The offline distribution channel dominated the global running shoes market, accounting for 63.2% of total revenue in 2025.
- Revenue generated through offline sales of running shoes reached US$31.68 billion in 2025 and is projected to increase to US$53.84 billion by 2035, expanding at a CAGR of 5.5%.
- The online distribution channel is projected to register the fastest growth, with a CAGR of 7.1% during the forecast period.
- Revenue generated through online running shoe sales is expected to increase from US$18.46 billion in 2025 to US$36.07 billion by 2035.
Average Running Shoe Price and Discount Frequency Statistics
- The average price of running shoes was US$135 in 2020, while 18% of products were offered at discounted prices.
- The average running shoe price increased to US$138 in 2021, accompanied by a discount frequency of 21%.
- The average selling price reached US$142 in 2022, with 23% of running shoes available at discounted prices.
- The average running shoe price rose to US$145 in 2023, while the discount frequency increased to 26%.
- The average selling price climbed to US$148 in 2024, with 29% of running shoes offered under promotional discounts.
- The average running shoe price reached US$152 in 2025, as the discount frequency increased to 31%.
- The average selling price is projected to reach US$155 in 2026, with the discount frequency expected to increase to 34%, indicating continued price growth alongside a greater prevalence of promotional offers.
Running Shoes Lifespan
- After approximately 500 kilometers of use, the pressure exerted on the bottom of the foot can increase by 100%, indicating a significant reduction in the cushioning effectiveness of running shoes.
- The foam structure of running shoes begins to deteriorate after approximately 750 kilometers of running, reducing overall support and shock absorption.
- Heel cushioning declines by 16% to 33% after approximately 480 kilometers of use, affecting the shoe’s ability to absorb impact efficiently.
- Running shoes typically have a lifespan of 500–750 kilometers (300–500 miles), after which they lose nearly 50% of their compression capability, making replacement advisable to maintain optimal comfort and performance.
Primary Motivations for Running
- Staying healthy and maintaining physical fitness is the leading motivation for running, cited by 72% of runners.
- 38% of runners participate in running to relieve stress, making it the second most common reason.
- 33% of runners identify enjoyment as a primary motivation for engaging in running activities.
- 31% of runners participate to achieve a personal challenge, reflecting the importance of self-improvement and goal attainment.
- 26% of runners train specifically for races or competitive events.
- 23% of runners aim to improve their speed and endurance through regular running.
- 21% of runners are motivated by the opportunity to appreciate nature while running.
- 20% of runners participate to achieve personal goals or performance records.
- 19% of runners value running as a form of solitude and personal time.
- 18% of runners engage in running to socialize, making it the least cited motivation among the factors analyzed.
Running Shoes Weight Statistics
- Men’s running shoes have an average weight of 9.8 ounces, while women’s running shoes average 8.4 ounces.
- Women’s running shoes are 15% lighter than men’s running shoes on average, reflecting differences in footwear design and construction.
- Road running shoes have an average weight of 9.7 ounces, whereas trail running shoes average 10.4 ounces, making trail models 7% heavier due to their enhanced durability and traction features.
- Motion-control running shoes are the heaviest category, with an average weight of 12.1 ounces, which is 19% heavier than the average running shoe.
- Road racing shoes are the lightest category, averaging 7.5 ounces, making them 31% lighter than the average running shoe to support enhanced speed and performance.
Types of Running Activities
- Casual running is the most common running activity, with 31% of runners participating in this format.
- Treadmill running ranks second, accounting for 30% of running activities.
- Road running is practiced by 21% of runners, making it one of the most popular outdoor running formats.
- Runs under 10 kilometers also account for 21% of running activities, reflecting a strong preference for shorter-distance runs.
- 15% of runners participate in runs accompanied by dogs, highlighting the popularity of combining exercise with pet activities.
- 12% of runners continue running while on holiday, demonstrating the importance of maintaining fitness routines during travel.
- Trail running is preferred by 11% of runners, indicating steady participation in off-road running activities.
- 9% of runners participate in group running sessions, emphasizing the role of social engagement in fitness.
- Interval running accounts for 8% of running activities, representing the least common running format among the categories analyzed.
Consumer Buying Behavior Analysis
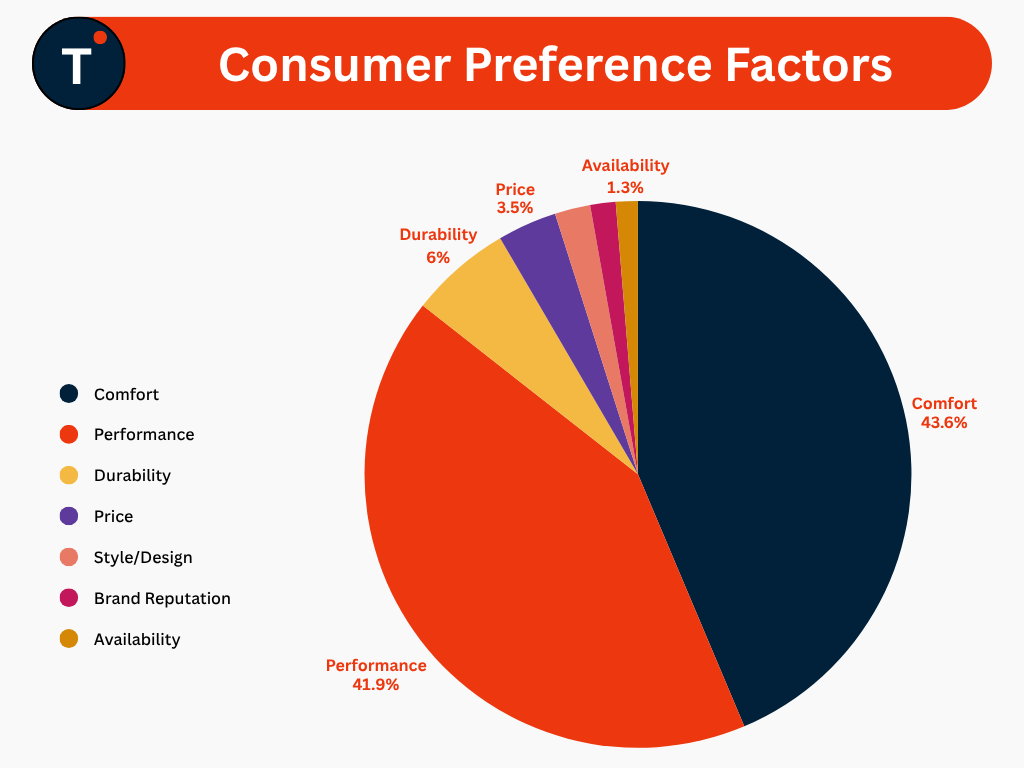
- Comfort is the most influential factor in running shoe purchasing decisions, accounting for 43.6% of consumer preference.
- Performance ranks as the second most important consideration, representing 41.9% of consumer preference.
- Durability contributes 6.0% to purchasing decisions, reflecting consumer emphasis on product longevity.
- Price accounts for 3.5% of consumer preference when selecting running shoes.
- Style and design influence 2.1% of purchasing decisions, highlighting the role of aesthetics in footwear selection.
- Brand reputation represents 1.5% of consumer preference, indicating a relatively limited impact compared with product performance attributes.
- Availability accounts for 1.3% of consumer preference, making it the least influential factor among the criteria analyzed.
MAP Compliance Trends
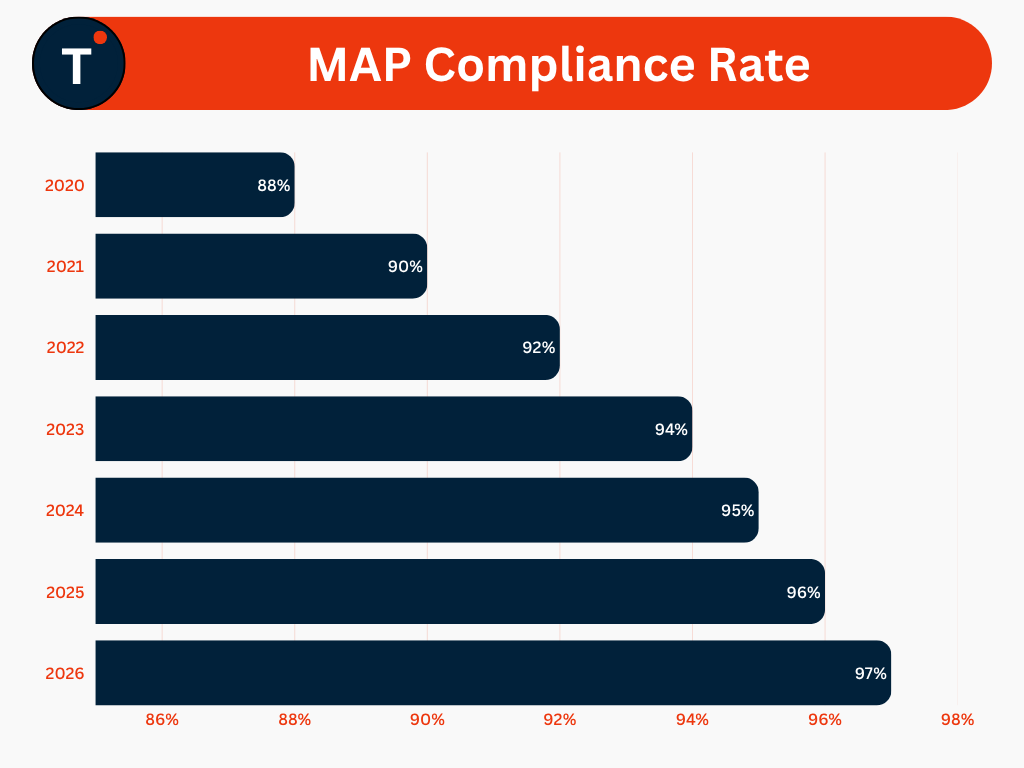
- The MAP compliance rate stood at 88% in 2020, establishing the baseline for the observed upward trend.
- The compliance rate increased to 90% in 2021, reflecting a 2 percentage point improvement over the previous year.
- MAP compliance reached 92% in 2022, continuing its steady year-over-year growth.
- The compliance rate rose to 94% in 2023, indicating sustained improvements in pricing policy adherence.
- MAP compliance increased to 95% in 2024, demonstrating continued progress toward higher compliance levels.
- The compliance rate reached 96% in 2025, maintaining the positive growth trajectory.
- MAP compliance is projected to attain 97% in 2026, representing the highest compliance level during the period analyzed.
Running Shoes Competitive Scenario
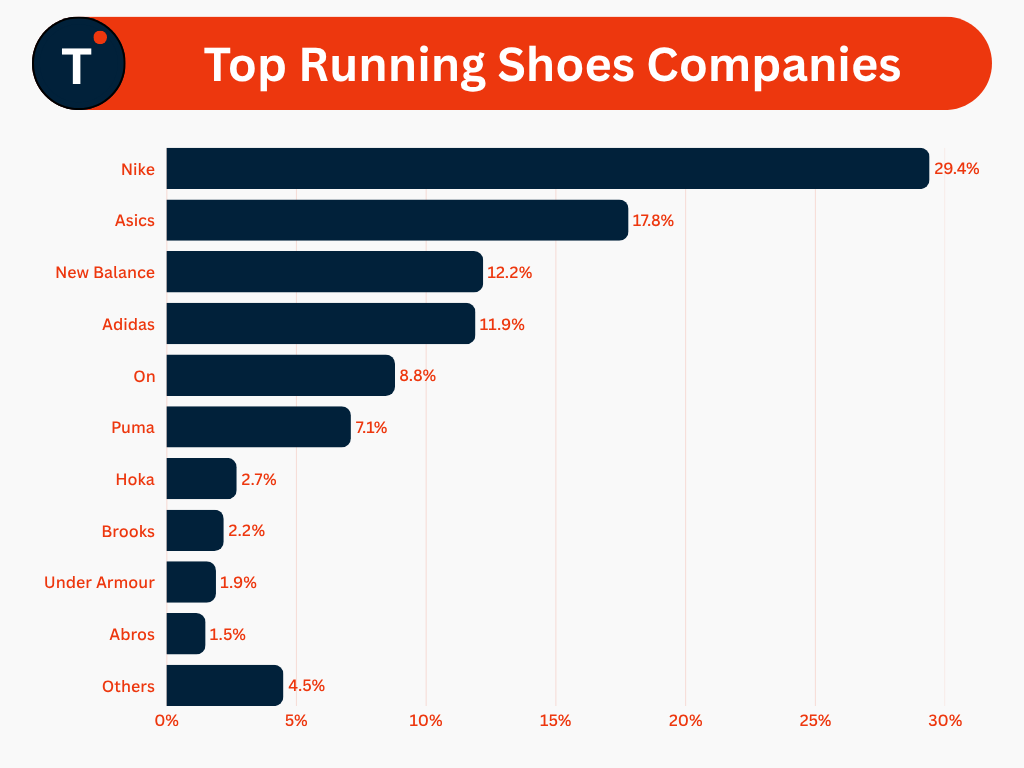
- Nike leads the global running shoes market with a 29.4% market share, maintaining the strongest competitive position among major brands.
- Asics ranks second with a 17.8% market share, reflecting its strong presence in the performance running footwear segment.
- New Balance accounts for 12.2% of the global running shoes market, positioning it among the leading manufacturers.
- Adidas captures 11.9% of the market, reinforcing its significant presence in the global running footwear industry.
- On holds an 8.8% market share, supported by growing demand for its performance-oriented running shoes.
- Puma represents 7.1% of the global running shoes market, maintaining a competitive position among established brands.
- Hoka accounts for 2.7% of the market, reflecting its expanding presence in the premium running footwear segment.
- Brooks captures 2.2% of the global running shoes market, supported by its focus on dedicated running products.
- Under Armour holds a 1.9% market share, contributing to the competitive landscape of the running shoes industry.
- Abros represents 1.5% of the global running shoes market, maintaining a niche position in performance running footwear.
- Other manufacturers collectively account for 4.5% of the global running shoes market, indicating the presence of numerous smaller and regional brands.
Recent Developments
- In July 2026, adidas introduced the Hyperboost Run, a high-energy daily trainer designed to deliver enhanced comfort and performance for everyday runners.
- In July 2026, adidas Originals launched the HYPERBOOST EUPHORIA, a lifestyle adaptation of the HYPERBOOST EDGE running silhouette that combines comfort, breathability, and contemporary design for everyday wear.
- In May 2026, adidas and SATISFY announced a multi-season partnership, debuting the limited-edition ADIZERO ADIOS PRO 4 SATISFY running shoe to strengthen their presence in the premium performance running segment.
- In March 2026, ASICS unveiled the NOVABLAST 6, the latest generation of its flagship running shoe featuring lightweight construction, responsive cushioning, and an enhanced energy-return ride.
- In March 2026, Brooks Running partnered with Major League Baseball’s Seattle Mariners to promote running and athletic performance through a strategic brand collaboration.
- In February 2026, Nike launched the Pegasus 42, introducing the latest iteration of its flagship running shoe with enhanced ride quality and performance capabilities.
- In October 2025, Nike unveiled Project Amplify, the world’s first powered footwear system designed for running and walking, marking a significant advancement in wearable performance technology.
Conclusion
- The global running shoes market is poised for sustained growth, driven by rising participation in recreational and competitive running, increasing health and fitness awareness, and continuous advancements in footwear technology.
- North America remains the largest regional market, while the United States continues to be a major revenue contributor, supported by a large base of active runners, high consumer spending on performance footwear, and strong demand for premium running shoes.
- Asia Pacific is expected to record the fastest market growth, fueled by expanding fitness participation, increasing disposable incomes, and the growing popularity of marathon and road-running events.
- Leading brands continue to strengthen their competitive position through product innovation, strategic partnerships, and retail expansion, while the market remains highly competitive with strong emphasis on research and development.
- Continued growth in the U.S. and global running communities, coupled with expanding e-commerce penetration and ongoing technological innovation, is expected to support the long-term expansion of the running shoes market through 2035.