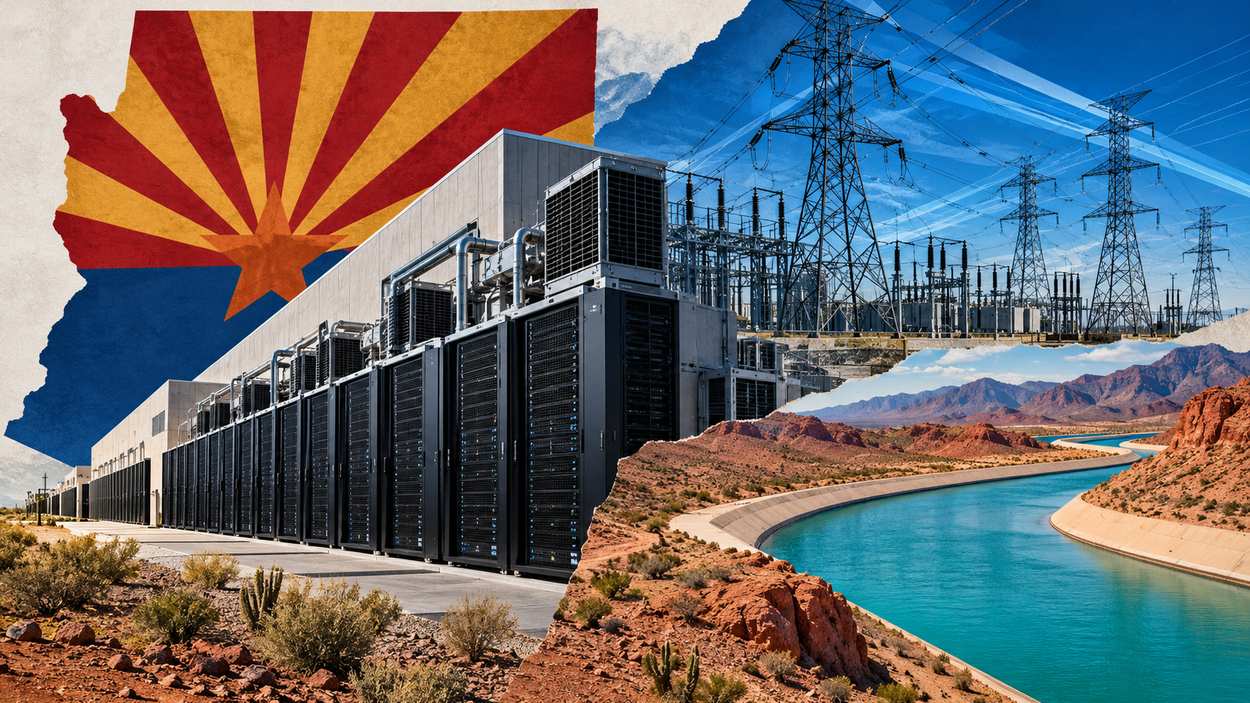


Pew Research Center counts 184 data centers in Arizona, 98 currently operating and 86 planned, in Data Center Map listings as of Feb. 19, 2026. CBRE Research puts the Phoenix market at 1,069.2 MW of inventory in Q2 2026, with 12.1 MW of available capacity.
Data centers were about 5% of APS’s total peak energy demand in 2025. APS also shows an uncommitted queue of 19.0 GW against a 2025 peak load of 8.7 GW. Governor Katie Hobbs signed a bill under which no new CDC certification applications will be accepted from July 1, 2026, through June 30, 2029. The sections below cover counts, megawatts, utility load, rate rules, the paused tax exemption and water use, with each figure attributed to the body that published it.
Key Takeaways
- Arizona has 184 data centers, of which 86 are planned, about 47% of the state total.
- APS’s 19.0 GW uncommitted queue is about 2.2 times its 8.7 GW 2025 peak load.
- Data centers were about 5% of APS’s total peak energy demand in 2025, and large data centers contributed 5.1% to SRP’s summer 2025 peak demand record.
- Phoenix had 12.1 MW of available capacity in Q2 2026, about 1.1% of its 1,069.2 MW inventory.
- No new CDC certification applications will be accepted from July 1, 2026, through June 30, 2029.
- WRA’s 2035 cooling-water estimates for the APS, SRP and TEP territories add up to 9,314 acre-feet a year.
Editor’s Choice
- Phoenix inventory: 1,069.2 MW of data center inventory in Q2 2026, per CBRE Research.
- Phoenix absorption: 442 MW absorbed in the first half of 2026, amid 1.7 GW under construction, per JLL.
- APS uncommitted queue: 19.0 GW, against a 2035 forecasted peak load of 12.0 GW.
- SRP generation capacity: approximately 8,000 MW, with some larger data centers at a 200 MW capacity load.
- APS capacity inquiries: up to 15,000 megawatts of new capacity, per Western Resource Advocates.
- EdgeCore Mesa campus: a minimum of 450 MW of critical load at full build-out.
Data Centers in Arizona by Operating Status
- Arizona has 184 data centers in the state table: 98 currently operating and 86 planned.
- Operating facilities make up about 53% of the Arizona total.
- Virginia and Texas have the most planned data centers (287 and 170), followed by Georgia (141), Illinois (123) and Arizona (86).
- Planned sites are about 42% of Virginia’s total and about 36% of Texas’s, against about 47% in Arizona.
- The planned category includes data centers listed as under construction, planned or land banked.
| State | Total | Currently operating | Planned |
|---|---|---|---|
| Virginia | 685 | 398 | 287 |
| Texas | 466 | 296 | 170 |
| California | 331 | 277 | 54 |
| Illinois | 262 | 139 | 123 |
| Georgia | 235 | 94 | 141 |
| Ohio | 223 | 166 | 57 |
| Arizona | 184 | 98 | 86 |
Source: Pew Research Center, Data Center Map data as of February 2026
About This Data
- Compiled from 15 sources: 6 Arizona state agencies and officials, 2 utilities, 1 data center developer, 2 research and advocacy groups, 2 commercial real estate releases, 1 tax advisory alert and 1 local news report.
- Dated sources run from August 2025 to September 2026, alongside an undated developer release and current utility and state program pages.
- Government, utility, company, research and real estate publications make up most of the list, alongside 1 tax advisory alert and 1 local news report; paid market-research reports were excluded.
- Figures are reviewed on a rolling basis and updated when sources publish new editions.
How many data centers are in Arizona?
Arizona has 184 data centers in Data Center Map listings as of Feb. 19, 2026, with 98 currently operating and 86 planned, according to Pew Research Center. The figure counts facility listings rather than megawatts, so a small site and a large campus each count once.
Phoenix Data Center Market vs Other Markets
- Phoenix held 1,069.2 MW of data center inventory in CBRE Research’s Q2 2026 data.
- Northern Virginia (4,496.5 MW), Atlanta (1,803.2 MW) and Dallas-Fort Worth (1,432.8 MW) held more inventory than Phoenix among the eight primary markets.
- Phoenix’s inventory is about 24% of Northern Virginia’s.
- JLL’s North American Data Center Report, Midyear 2025, ranked metro Phoenix second in North America for data center development, with Dallas-Fort Worth third.
- APS says the Phoenix metro area ranks second in North America for proposed data center development.
View the data
CBRE counts built megawatts in a metro market, while Pew counts facility listings across a state, so the two rankings answer different questions. Broader data center statistics and rankings of the largest data centers in the US rest on the same split between sites and megawatts.
Recent Developments
- September 8, 2026: CBRE’s report on the first half of 2026 put Phoenix inventory at 1,069.2 MW, with 12.1 MW of available capacity.
- August 31, 2026: Attorney General Kris Mayes called for a statewide pause on the approval and construction of new data centers, particularly hyperscale AI projects, and announced a town hall in Ahwatukee on October 14, 2026, about Menlo Digital’s planned hyperscale data center project.
- August 21, 2026: A federal two-year Colorado River plan requires Arizona to cut its consumption by 760,000 acre-feet.
- August 12, 2026: The Arizona Corporation Commission voted unanimously to approve a cooperative process that protects existing ratepayers from the costs of new transmission and infrastructure for new large-load customers.
- August 11, 2026: JLL reported that Phoenix absorbed 442 MW in the first half of 2026, amid 1.7 GW under construction.
Phoenix Data Center Capacity, Pipeline and Campuses
- Phoenix’s 12.1 MW of available capacity in CBRE’s Q2 2026 data is about 1.1% of the market’s inventory.
- Approximately 1,300 MW of data center development was under construction and 4,154 MW was planned, according to the Arizona Corporation Commission’s September 2025 release.
- Phoenix’s data center project pipeline has more than tripled since 2020, with about 5 GW of projects being built or still in planning.
- A developer announced a 2,000-acre property in Buckeye with plans for a $20 billion data center park.
- EdgeCore’s Mesa campus had one operational data center and two more under construction, totaling 206 MW of critical load, at the time of its $1.9 billion debt financing release.
View the data
Dallas-Fort Worth had 39.6 MW of available capacity and Hillsboro, OR had 1.1 MW, so Dallas-Fort Worth had about 3.3 times Phoenix’s available capacity. The Phoenix pipeline below, part of national data center construction statistics, comes from different firms and dates, so its figures are listed side by side rather than added together.
| Measure | Value | Publisher | As of |
|---|---|---|---|
| Phoenix absorption (MW) | 442 | JLL | H1 2026 |
| Phoenix under construction (GW) | 1.7 | JLL | H1 2026 |
| Metro Phoenix under construction (MW) | approximately 1,300 | Arizona Corporation Commission | September 2025 |
| Metro Phoenix planned (MW) | 4,154 | Arizona Corporation Commission | September 2025 |
| Phoenix pipeline under construction or planned (GW) | about 5 | Arizona Corporation Commission | September 2025 |
| EdgeCore Mesa campus at full build-out (MW) | minimum of 450 | EdgeCore | Financing release |
Source: JLL, August 2026; Arizona Corporation Commission, September 2025; EdgeCore Digital Infrastructure
APS Data Center Load and Peak Demand Forecast
- Data centers were about 5% of APS’s total peak energy demand in 2025.
- APS’s 2025 peak load was 8.7 GW, and its 2035 forecasted peak load is about 38% higher.
- APS’s uncommitted queue of 19.0 GW represents potential projects that could more than double current demand.
- A share of about 5% of the 2025 peak works out to roughly 0.44 GW of data center load.
- APS says the average data center in its service territory needs as much energy as about 64,000 homes and operates near peak capacity 24 hours a day, 7 days a week.
- APS puts a data center at approximately 400 MW, with requests up to 2,000 MW.
- APS says it does not yet have enough power plants, transmission lines and key infrastructure to serve all these new requests.
- Utility peak shares sit alongside national data center energy consumption estimates, which measure annual electricity use rather than peak demand.
View the data
By the numbers: Data centers’ share of about 5% of APS’s 8.7 GW 2025 peak works out to roughly 0.44 GW, while APS’s uncommitted queue stands at 19.0 GW. The queue holds requests APS has not committed to serve, so it measures interest in Arizona power rather than load the utility has agreed to deliver.
How much power do Arizona data centers use?
APS says data centers were about 5% of its total peak energy demand in 2025, and SRP says large data centers contributed 5.1% to its summer 2025 peak demand record. APS adds that the average data center in its service territory needs as much energy as about 64,000 homes and operates near peak capacity 24 hours a day, 7 days a week.
SRP Data Center Load and Large Customer Growth
- Large data centers contributed 5.1% to SRP’s summer 2025 peak demand record.
- Data centers are projected to be SRP’s fastest-growing customer segment.
- SRP’s current generation capacity is approximately 8,000 MW, and some of the larger data centers on its system have a capacity load of 200 MW.
- One 200 MW data center equals about 2.5% of SRP’s generation capacity.
- Between 2025 and 2035, SRP projects its large customer load will grow by approximately 2,700 megawatts, with roughly 2,200 megawatts of new load attributed to data centers.
- Data centers account for about 81% of SRP’s projected large customer load growth.
- SRP says Maricopa County is on track to become one of the largest markets for data centers in the United States.
SRP’s growth projection and APS’s queue cover different territories, so the two should not be added together.
TEP and Rural Cooperative Data Center Demand
- TEP reported that it has received over 10,000 megawatts of interconnection requests.
- As of early 2025, TEP was developing contracts for 300 megawatts of new data center load, which could come online starting in 2027.
- TEP expects negotiations with additional customers representing approximately 600 megawatts of new load in the 2030 timeframe.
- The distribution cooperatives that filed the joint application say they are in talks with several prospective large-load businesses looking to build new facilities in their service territories.
- APS has noted that the data centers historically located in Central Arizona provide cloud computing services rather than AI, so their load grows more steadily.
| Utility | Measure | Megawatts |
|---|---|---|
| APS | Inquiries for new capacity | up to 15,000 |
| APS | Net summer peak load | approximately 8,000 |
| SRP | Large customer load growth, 2025 to 2035 | approximately 2,700 |
| SRP | Data center share of that growth | roughly 2,200 |
| TEP | Interconnection requests | over 10,000 |
| TEP | New data center load under contract development | 300 |
| TEP | Additional load in expected negotiations, 2030 timeframe | approximately 600 |
Source: Western Resource Advocates, August 2025
The WRA fact sheet dates from August 2025, more than 12 months before publication, and its APS figure is a net summer peak, a different measure from the 2025 peak load APS now publishes.
Who Pays for Data Center Grid Upgrades in Arizona
- In its June 2025 rate request to the Arizona Corporation Commission, APS proposed a more than 45% rate increase for these extra-large energy users, including data centers.
- APS’s other proposals include updates to its extra high load factor (XHLF) rates, minimum bill and collateral requirements.
- APS developed a high load factor rate in 2017 to ensure rates paid by these customers reflected the cost to serve them.
- In 2025, SRP introduced the Large Customer Integration Process (LCIP), under which new large-load customers must pay upfront for their upgrade costs.
- SRP’s E-67 price plan, approved in 2025, bills new accounts with at least 20 MW of forecasted load on the greater of actual demand or 80% of forecasted load.
- The Arizona Corporation Commission hosted an initial workshop on large load and data center customers on April 16, 2026.
| Utility or regulator | Rule for large loads | Status |
|---|---|---|
| APS | Rate increase of more than 45% for extra-large energy users | Proposed in June 2025 rate request |
| APS | XHLF rate, minimum bill and collateral updates | Proposed |
| SRP | Upfront payment for upgrade costs (LCIP) | Introduced in 2025 |
| SRP | Minimum bill at the greater of actual demand or 80% of forecast load, new accounts with 20 MW or more of forecasted load (E-67) | Approved in 2025 |
| Arizona Corporation Commission | Large-load process for electric cooperatives | Approved August 12, 2026 |
Source: Arizona Public Service, Salt River Project and Arizona Corporation Commission, 2025 and 2026
Worth noting: APS’s more than 45% increase for extra-large energy users is a proposal in its June 2025 rate request to the Arizona Corporation Commission. SRP’s minimum bill at 80% of forecasted load, by contrast, covers new accounts of at least 20 MW under its E-67 plan, approved in 2025.
Do data centers raise APS or SRP electric bills?
APS says its proposed increase is meant to ensure data centers continue to pay for their costs of service and avoid shifting those costs to families or small businesses. SRP says new large-load customers pay upfront for their upgrade costs so these costs are not paid by other SRP customers. Both are utility statements, and APS proposed its increase in a June 2025 rate request.
Arizona Data Center Tax Exemption and the 2026 Moratorium
- Arizona’s CDC incentive, administered by the Arizona Commerce Authority, provides Transaction Privilege Tax (TPT) and use tax exemptions at the state, county and local levels on qualifying purchases of CDC equipment.
- An owner, operator or qualified co-location tenant can receive the exemptions for up to ten full calendar years, or up to 20 for a Sustainable Redevelopment Project.
- A facility in Maricopa or Pima County needs a capital investment of at least $50 million within five years of certification, against $25 million in any other county, and an Existing CDC needed at least $250 million invested between September 2007 and August 2013.
- Governor Katie Hobbs said, in remarks published by her office on January 13, 2026, that her executive budget would eliminate the Data Center Tax Exemption, which she called a corporate handout.
- As part of the Fiscal Year 2027 budget, no new CDC certification applications will be accepted from July 1, 2026, through June 30, 2029.
View the data
Key finding: KPMG’s state tax alert says computer data centers that had completed state certification requirements and qualified for Arizona incentives prior to the moratorium implementation will retain their tax preferences, as the freeze applies only to new applications. The pause stops new certifications for three years without removing exemptions already granted.
Does Arizona still offer a data center tax exemption?
Data centers certified before the moratorium keep their tax preferences, but no new CDC certification applications will be accepted from July 1, 2026, through June 30, 2029. Certified facilities can hold the exemptions for up to ten full calendar years, or up to 20 for a Sustainable Redevelopment Project.
Arizona Data Center Water Use
- WRA estimates the new cooling water demand of data centers served by SRP could be 1,020 acre-feet a year in 2030 and 4,049 acre-feet in 2035.
- WRA’s 2035 estimates for the APS, SRP and TEP territories add up to 9,314 acre-feet a year.
- That total is about 43% of the 21,600 acre-feet of on-site water use WRA projects for new data centers across the Interior West in 2035.
- ADWR does not track water usage for most data centers, and the companies are not required to publicly report usage in Arizona.
- A September 2025 report from Ceres estimated that Phoenix-area data centers use 385 million gallons annually for cooling, rising to 3.3 billion gallons including the water needed for power generation.
- A February 2026 report from ASU’s Kyl Center for Water Policy found no evidence that water use by electricity suppliers has increased in central Arizona.
- WRA’s 2035 total equals about 1.2% of the 760,000 acre-feet Arizona must cut from its Colorado River consumption under the federal two-year plan.
View the data
Governor Hobbs noted that the average Arizona family pays one cent for every gallon of water used in their home, and if data centers paid the same amount, the state could make a multi-million dollar deposit into the Colorado River Protection Fund every year. KJZZ, reporting with Cronkite News, did the math: Raising $6 million would require 600 million gallons, or 1,841 acre-feet. National data center water usage estimates also mix cooling-only and power-inclusive scopes, so compare them with care.
How much water do Arizona data centers use?
ADWR does not track water usage for most data centers, and companies are not required to publicly report it in Arizona. Ceres estimated Phoenix-area data centers use 385 million gallons a year for cooling and 3.3 billion gallons including power generation. WRA’s cooling-only estimates for the APS, SRP and TEP territories reach 9,314 acre-feet a year by 2035.
Conclusion
Arizona has 184 data centers, 86 of them planned, and APS shows a 19.0 GW uncommitted queue against an 8.7 GW 2025 peak load. Data centers were about 5% of APS’s 2025 peak demand and large data centers 5.1% of SRP’s summer 2025 peak record. The gap between today’s share and the requested load is the figure to watch, because it shows how much of the Arizona build-out is still only a request.
New CDC certification applications are paused through June 30, 2029, and APS proposed a more than 45% rate increase for extra-large energy users in its June 2025 rate request. Rate decisions by the Arizona Corporation Commission and whether lawmakers act on the Attorney General’s call for a pause will shape how much of the queue becomes connected load.