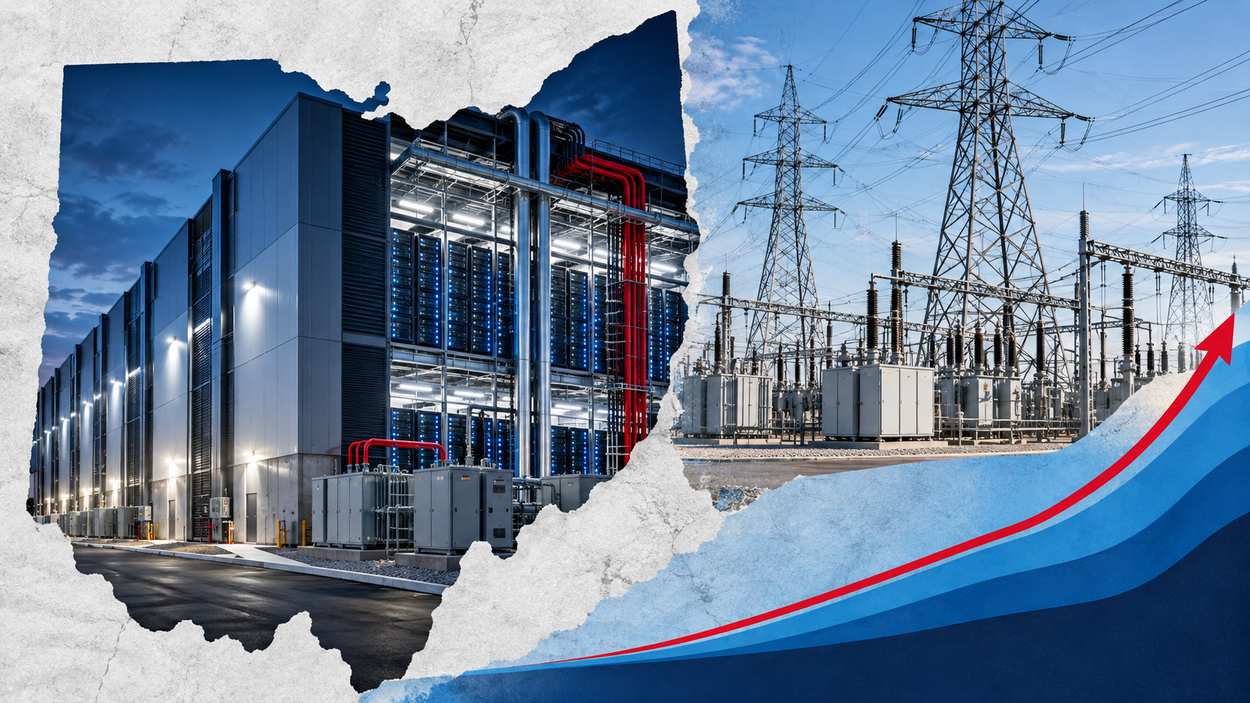


Data centers in Ohio number 217, the fifth most of any state, per Representative Emilia Sykes’s office in February 2026. Most are in Central Ohio, where land availability, transmission access and proximity to consumers make development attractive. AEP Ohio has signed 5,642 MW of data center load under its new tariff, against requests to connect more than 30,000 MW that the utility reported in 2024.
AEP’s latest load forecast puts AEP Ohio’s cumulative load additions at 15,574 MW in 2031. Through 2031, 97% of projects in the forecast are backed by take-or-pay ESA contracts. Data centers previously granted Ohio sales and use tax benefits reported $27.2 billion of capital investment in 2025. The sections below cover facility counts, utility load, the tariff, on-site generation, investment and state legislation, each with its source and date.
Key Takeaways
- Ohio’s data center count runs from more than 100 operational facilities in Weldon Cooper Center data, to roughly 200 by some estimates cited by the Ohio House, to more than 200 in a state consumer fact sheet, to 217 per Rep. Sykes’s office.
- AEP Ohio signed 5,642 MW of data center load under its tariff, while the Central Ohio interconnection queue totaled 38 GW in AEP’s 2025 filing.
- AEP Ohio’s ultimate load forecast is 6,521 MW lower than in the 2025 submission, a reduction AEP says is driven by enactment of the state’s Data Center Tariff.
- AEP Ohio accounts for 69.6% of the 24,596 MW in ultimate cumulative additions across AEP’s four operating companies in the forecast.
- The OPSB authorized the construction of, or had applications submitted for, over 2,000 MW of behind-the-meter dispatchable generation in 2025.
- SB Energy is committed to paying for $4.2 billion in new transmission for a planned 10-gigawatt data center campus at Piketon.
- Data centers are expected to more than double their share of Ohio’s energy consumption in the next four years, from 5.3% to 10.9%.
Editor’s Choice
- Tariff floor: at least 85% of contracted electricity capacity, paid for up to 12 years, even if a data center uses less.
- AEP Ohio forecast: 15,574 MW of cumulative load additions in 2031.
- AEP systemwide: 69 GW of new load additions through 2030.
- Tax-benefit investment: a total capital investment of $27.2 billion in 2025, reported by data centers previously granted sales and use tax benefits.
- Planned investment: up to $40 billion more in Ohio data centers by 2030.
- More gas generation: another 2,755 MW of traditional gas generating facilities gave pre-application notice.
Number of Data Centers in Ohio by Source
- Ohio is home to 217 data centers, the fifth most of any state, including multiple facilities in Stark and Summit counties.
- The Ohio Consumers’ Counsel fact sheet also ranks Ohio as the fifth-highest state in the country.
- Additional facilities are being proposed, according to the Ohio House.
- Ohio is slated to get another 77 data centers by 2030, according to data compiled by the Weldon Cooper Center for Public Service.
- The Weldon Cooper Center’s data was sourced primarily from Standard & Poor’s/451 and supplemented with microdata from individual facilities and utilities’ proprietary data.
| Source | Ohio data centers | What is counted |
|---|---|---|
| Office of Representative Emilia Sykes (February 2026) | 217 | Data centers in Ohio, fifth most of any state |
| Ohio Consumers’ Counsel | more than 200 | Data centers in Ohio, fifth-highest state |
| Ohio House of Representatives | roughly 200 | Operating in Ohio, according to some estimates |
| Weldon Cooper Center data via WOSU | more than 100 | Operational data centers |
Source: Office of Representative Emilia Sykes, Ohio Consumers’ Counsel, Ohio House of Representatives, WOSU (Weldon Cooper Center data), 2026
Worth noting: Weldon Cooper Center data counts more than 100 operational data centers in Ohio, while Rep. Sykes’s office counts 217 and the Ohio House cites roughly 200 according to some estimates. The counts differ, and each names what it covers: Weldon Cooper Center data counts operational data centers, the Ohio House cites estimates of data centers operating in Ohio, and Rep. Sykes’s office counts the data centers Ohio is home to.
A facility count also weighs a small server room the same as a hyperscale campus. Rankings of the largest data centers in the US rest on size instead.
About This Data
- Compiled from 23 sources in 15 publications: 19 from Ohio state agencies, the Ohio House, a congressional office and AEP filings, 1 university research release, and 3 news and trade association reports.
- Sources were published between June 2024 and September 2026.
- Utility filings, regulator records and government releases were preferred; paid market-research reports were excluded.
- Figures are reviewed on a rolling basis and updated when sources publish new editions.
How many data centers are in Ohio?
Ohio has 217 data centers by the count from Rep. Emilia Sykes’s office, the fifth most of any state. A state consumer fact sheet puts the figure at more than 200, and Weldon Cooper Center data counts more than 100 operational facilities, with another 77 slated by 2030.
AEP Ohio Data Center Load Forecast
- AEP Ohio’s cumulative load additions climb from 4,980 MW in 2027 to 17,116 MW at the forecast’s ultimate horizon.
- The figures represent existing and planned large load submissions.
- AEP now plans only for contracted, financially committed load for the entire planning horizon.
- For load additions to be included in the forecast, they must have a signed LOA and/or ESA.
- New large load and data center tariffs require longer-term commitments from new customers, with terms that can span up to 12 years and beyond depending on the jurisdiction.
- AEP says load growth has become disconnected from underlying economics and unpredictable using traditional modeling techniques.
View the data
Recent Developments
- September 29, 2026: AEP’s new load forecast showed that through 2031, 97% of projects are backed by take-or-pay ESA contracts and 3% by LOA.
- September 15, 2026: OCC filed testimony at the Public Utilities Commission of Ohio on the 2025 Long-Term Forecast Report of Ohio Power Company.
- September 3, 2026: OCC filed a protest at the Federal Energy Regulatory Commission against PJM Interim Resource Adequacy Service.
- August 25, 2026: OCC filed reply comments for consumer protection on the FE Data Center Tariff at the Public Utilities Commission of Ohio.
- July 30, 2026: AEP reported approval of a distribution base rate decrease for customers in Ohio, and Virginia’s approval of a large load tariff brought AEP’s states with approved large load tariffs to five.
AEP Ohio Data Center Tariff Statistics
- On July 9, 2025, the PUCO adopted a settlement requiring new, large data centers to pay for at least 85% of the electricity capacity they contract for, even if they use less.
- AEP Ohio proposed the tariff in May 2024, and to the PUCO’s knowledge it was the first data center-specific tariff approved in the country.
- New data centers must provide collateral, pay a minimum demand charge, sign long-term contracts and pay exit fees if they end electric service early.
- OCC was a party to the settlement in Case No. 24-508-EL-ATA, along with AEP, PUCO Staff, Ohio Partners for Affordable Energy and others.
- According to the OCC, Amazon, Google, Microsoft and Meta opposed the settlement and proposed an alternative that would have shifted more costs onto residential consumers’ electric bills.
- Data center industry groups appealed the decision to the Supreme Court of Ohio in November 2025.
| Tariff term | Requirement |
|---|---|
| Capacity payment | At least 85% of contracted capacity |
| Payment period | Up to 12 years |
| Contract length | At least 8 to 12 years |
| Collateral | Required |
| Minimum demand charge | Required |
| Exit fees | Due if service ends early |
Source: Ohio Consumers’ Counsel, 2025; Public Utilities Commission of Ohio, 2026
According to PUCO Chair Jenifer French, “While 5,642 MW is still a lot of load, it’s a lot less than 30,000 MW. This tariff unquestionably helped AEP Ohio to refine the amount of load in its data center queue, thereby saving other ratepayers millions of dollars in unnecessary infrastructure.”
What is the AEP Ohio data center tariff?
AEP Ohio’s Data Center Tariff requires new, large data centers to pay for at least 85% of their contracted electricity capacity for up to 12 years, even if they use less. AEP Ohio proposed it to secure long-term commitments that would protect its other customers from the cost of the infrastructure needed to serve data centers.
Ohio Data Center Queue: Requested vs Signed Load
- In 2024, AEP Ohio reported it had received requests to connect more than 30,000 MW of data center load.
- It was difficult for AEP Ohio to determine how much of that load was real and how much was speculative.
- The Central Ohio total interconnection queue stood at 38 GW in AEP’s 2025 filing.
- Queue projects must commit to a non-refundable study fee and cannot sign an LOA or ESA until the study is complete.
- AEP counted 13.0 GW of study requests filed with a fee as of September 8, 2025, adjusted them to 11.1 GW under the tariff’s 85% provision, and estimated that their load ramps begin in 2031 and gradually accelerate through 2035.
- In February 2026, AEP Ohio announced that it had signed 5,642 MW of data center load under the new tariff.
- The 5,642 MW signed equals 18.8% of 30,000 MW, the floor of the 2024 requests.
View the data
A utility queue is one gauge of demand; the national data center statistics measure the same build-out through construction, vacancy and capital spending. Signed contracts are the narrower measure, and the one AEP now plans around.
AEP Load Forecast Revisions, 2025 vs 2026
- AEP Ohio’s ultimate forecast is 6,521 MW lower than in the 2025 submission, and AEP says the reduction is driven by enactment of the state’s Data Center Tariff.
- AEP Ohio’s 2031 additions are 3,755 MW above the 2025 submission.
- AEP Ohio’s 2030 additions are 4,171 MW above the 2025 submission.
- AEP attributes the near-term decreases at AEP Ohio and I&M to customers that have already come online.
- Mid-term increases across all operating companies are driven by new incremental large load.
View the data
The company-wide totals tell a different story from AEP Ohio’s line:
- Across all AEP operating companies, the 2026 submission shows 22,095 MW of ultimate cumulative additions, against 22,272 MW in the 2025 submission.
- AEP’s separate cumulative table, which represents existing and planned large load submissions, puts Total AEP at 24,596 MW at the ultimate horizon, and AEP Ohio’s 17,116 MW is 69.6% of that total.
View the data
Key finding: AEP says the Data Center Tariff allowed AEP Ohio to finally sign contracts with a number of customers previously in the queue beyond 2031, and those signed loads are now reflected earlier in the forecast. The ultimate totals barely moved while the timing did, and the cumulative table and comparison slide use different bases, so their totals are not interchangeable.
Behind-the-Meter Power for Ohio Data Centers
- In 2025 alone, the OPSB authorized the construction of, or had applications submitted for, over 2,000 MW of behind-the-meter dispatchable generation.
- Another 2,755 MW of traditional gas generating facilities gave pre-application notice to expand existing facilities or site new generation in the state.
- The OPSB received separate notices for another three proposed behind-the-meter natural gas generating facilities, in Ashville, Millersport and New Albany.
- A 1,300 MW facility proposed in Millersport comes with approximately 1,000 MW of battery storage.
- A $33 billion, 10-gigawatt natural gas power plant project in Piketon, announced by the Trump Administration in partnership with Japan, will power a large data center campus.
- AEP Ohio expects power to begin flowing to the Piketon site in 2029, over new 765-kilovolt transmission.
View the data
Why it matters: SB Energy is committed to paying for the $4.2 billion in new transmission investments to help avoid increases to transmission rates for Ohio residents. Developer-funded wires and on-site plants move part of the build-out cost away from other utility customers, the same goal the tariff pursues through contracts.
AEP Contracted Load and Large Load Tariffs
- AEP expanded new load additions to 69 GW through 2030.
- AEP added an incremental six GW of signed load agreements in the second quarter, primarily in Texas, with customers including hyperscalers, data centers and industrials.
- Five AEP states now have approved large load tariffs, with three additional state filings pending approval.
- AEP’s regulatory outcomes in the quarter included approval of a distribution base rate decrease for customers in Ohio.
| AEP measure | Figure |
|---|---|
| Contracted load growth through 2030 | 69 GW |
| Gas-fired turbine capacity secured | approximately 13 GW |
| Additional gas capacity under evaluation | 10 GW |
| Expected cost offsets from load growth | up to $16 billion |
| Expected customer savings from federal loan guarantees and grants | $1.4 billion |
Source: American Electric Power, Q2 2026 earnings release
AEP’s Fehrman said the company has led efforts to implement large load tariffs and structure contracts to ensure growth helps pay for growth. In Ohio, that principle takes the form of the 85% capacity payment.
AEP Ohio vs Other AEP Utilities
- AEP Ohio’s cumulative additions of 15,574 MW in 2031 compare with 22,175 MW for Total AEP in AEP’s separate cumulative table of existing and planned large load submissions.
- AEP Ohio’s 17,116 MW of ultimate additions are 3.95 times those of Indiana & Michigan Power.
- Kentucky Power’s cumulative additions step from 33 MW in 2028 to 533 MW in 2029.
- Appalachian Power filed a base rate request in Virginia, which approved a large load tariff in the second quarter.
View the data
How a large load tariff works in Virginia’s data center market is the next test of the contract model Ohio approved in July 2025.
Columbus and Central Ohio Data Center Cluster
- New data centers will propel Columbus past New York City to become the second-largest data center hub in the Great Lakes region, after Chicago.
- Central Ohio holds most of the state’s data centers, with land availability, transmission access and proximity to consumers making development attractive.
- As of 2024, the Great Lakes region had 525 data centers, according to data compiled by the Weldon Cooper Center.
- Google’s three Central Ohio data center locations are in Columbus, Lancaster and New Albany.
- A 430 MW behind-the-meter natural gas facility has been proposed in New Albany.
| Great Lakes measure | Figure |
|---|---|
| Data centers in the region, 2024 | 525 |
| Data centers planned by 2030 | 224 |
| States covered by the Weldon Cooper Center study | eight |
| States where data center energy demand will more than double | five |
Source: WOSU (Weldon Cooper Center data), Weldon Cooper Center for Public Service, 2026
The Weldon Cooper Center study covered New York, Pennsylvania, Illinois, Indiana, Ohio, Michigan, Wisconsin and Minnesota.
Data Center Investment in Ohio
- AWS estimates it invested $10.3 billion in Ohio and contributed $3.8 billion to the state’s gross domestic product between 2015 and 2023.
- AWS’s latest $10 billion pledge came on top of $7.8 billion announced the previous year and more than $6 billion invested through 2022.
- Google’s $2.3 billion plan followed an initial $4.4 billion invested since it broke ground on its New Albany data center in 2019.
- Companies plan to invest up to $40 billion more in Ohio data centers by 2030.
- While construction creates short-term jobs, data centers create relatively few permanent jobs once they are built.
| Company or group | Figure | What it covers |
|---|---|---|
| Amazon Web Services | $23 billion | Total Ohio investment since 2015, by the end of 2030 |
| Amazon Web Services | $10 billion | Additional funding to expand data center infrastructure |
| Data centers with sales and use tax benefits | $27.2 billion | Reported capital investment in 2025 |
| $6.6 billion | Total Ohio investment, including the planned $2.3 billion | |
| All companies | up to $40 billion | Planned additional investment by 2030 |
Source: Spectrum News 1 (Ohio governor’s office), Office of Governor Mike DeWine, Ohio Manufacturers’ Association, Ohio Consumers’ Counsel, 2024 to 2026
These figures come from different dates and cover different scopes, so they are listed side by side and never added together.
Which companies have data centers in Ohio?
Amazon Web Services will have invested $23 billion in Ohio since 2015 by the end of 2030, according to Governor DeWine’s office. Google has three Central Ohio data center sites in Columbus, Lancaster and New Albany, and a total Ohio investment of $6.6 billion. A 10-gigawatt data center campus is planned at the former gaseous diffusion plant in Piketon.
Ohio Data Center Electricity Use and Utility Bills
- New data centers are expected to more than double the industry’s share of Ohio’s energy consumption in the next four years, from 5.3% to 10.9%.
- The 176 TWh that data centers used nationwide in 2023 is roughly equal to the total electricity used by the entire state of Ohio that year.
- A large or hyperscale data center can use as much electricity as 100,000 homes. The hyperscale data center figures track how many such campuses are operating nationally.
- Several large-scale data centers operating or under construction in Rep. Sykes’s district are expected to consume electricity equivalent to tens of thousands of homes.
- Some data centers use millions of gallons of fresh water per day for cooling. Ohio’s share of data center water use depends on which cooling systems new campuses choose.
- In June 2025, many Ohio consumers saw electric supply price increases of 10% to 35%.
| Measure | Figure | Scope |
|---|---|---|
| Data center share of Ohio energy consumption, now | 5.3% | Ohio, Weldon Cooper Center data |
| Data center share in four years | 10.9% | Ohio, Weldon Cooper Center data |
| US data center electricity use, 2023 | 176 TWh | United States |
| Share of US electricity, 2023 | roughly 4% | United States |
| Expected share of US electricity, 2030 | 9% | United States |
| Electric supply price increases, June 2025 | 10% to 35% | Many Ohio consumers |
Source: WOSU (Weldon Cooper Center data), 2026; Ohio Consumers’ Counsel, 2026
How much electricity will Ohio data centers use?
Data centers’ share of Ohio’s energy consumption is expected to more than double in the next four years, from 5.3% to 10.9%, according to Weldon Cooper Center data. The Weldon Cooper Center also finds that data centers’ energy demand will more than double in five of the eight Great Lakes states as new and larger data centers come online.
Ohio Data Center Tax Exemption and Legislation
- Governor Mike DeWine directed the chair of the Ohio Tax Credit Authority to pause consideration of any new data center tax exemption requests while the General Assembly’s Joint Data Center Committee studies data center growth.
- The action only suspends the ability for data centers to request tax exemptions in Ohio, and the governor’s office says it is not a data center ban.
- The Ohio House unanimously passed House Bill 646, establishing the Ohio Data Center Study Commission.
- Key concerns behind the bill include the use of agricultural land, noise pollution, water use and disposal, energy demand and national security.
- As of April 2026, eight pieces of data center-related legislation were being considered by the General Assembly.
| Bill | Subject |
|---|---|
| HB 646 | Create Data Center Study Commission |
| HB 695 | Ban NDAs for local officials related to data center transparency concerns |
| HB 706 | Minimum requirements for data center customers |
| HB 710 | Prohibit public support or limit new data centers |
| HB 784 | Require data center water use reports |
| SB 374 | Ban new data center tax exemptions |
| SB 378 | Data centers pay own water costs and permits |
| SB 381 | PUCO approval required for large data center grid connection |
Source: Ohio Consumers’ Counsel, April 2026
Does Ohio give data centers a tax break?
Yes: Ohio has granted data centers sales and use tax benefits, and those recipients reported a total capital investment of $27.2 billion in 2025. Governor DeWine has paused new data center tax exemption requests while the General Assembly studies the issue, and SB 374 would ban new data center tax exemptions.
Conclusion
Ohio is home to 217 data centers, the fifth most of any state. AEP Ohio has signed 5,642 MW of data center load under its tariff, against requests for more than 30,000 MW reported in 2024. The tariff helped AEP Ohio separate signed load from speculative requests, and AEP’s forecast now counts only load with a signed ESA or LOA across its operating companies.
AEP Ohio’s forecast reaches 17,116 MW of cumulative additions at its ultimate horizon, while new data center tax exemption requests stay paused during the legislature’s study. How much of that load reaches the grid will decide Ohio’s share of national data center energy consumption.