


The U.S. healthcare sector continues to expand, with nursing representing a critical component of the workforce. Nurses play a central role in healthcare delivery, contributing to care quality, patient outcomes, operational performance, and workforce stability. Education, specialized training, certification, and career advancement pathways increasingly support workforce engagement and long-term retention. The adoption of advanced technologies, including artificial intelligence (AI), is also creating opportunities to enhance clinical training, streamline administrative processes, and improve workforce efficiency.
Editor’s Choice
- The global nursing workforce comprises an estimated 29 million nurses and 2.2 million midwives, with the WHO projecting a shortage of 4.5 million nurses and 0.31 million midwives by 2030.
- More than 80% of the global nursing workforce is concentrated in countries representing only 50% of the world’s population, highlighting significant geographic disparities in workforce distribution.
- Nursing represents the largest healthcare profession in the U.S., with more than 5 million registered nurses (RNs) nationwide, of whom 88% are employed in nursing.
- Nurses account for more than 50% of the U.S. healthcare workforce, underscoring their critical role across the healthcare system.
- The median age of U.S. registered nurses stands at 50 years, indicating an aging nursing workforce.
- 40% of RNs plan to retire or leave the nursing profession within the next 5 years, up from 28.7% in 2022.
- The U.S. federal government projects more than 189,000 registered nurse job openings annually through 2034, reflecting sustained workforce demand.
- Nearly 60% of RNs work in general medical and surgical hospitals, with an average annual salary of USD 97,260.
- RN employment is projected to increase by 5% from 2024 to 2034, exceeding the average growth rate across all occupations.
- Employment of nurse anesthetists, nurse midwives, and nurse practitioners is projected to grow by more than 35% over the next decade, with approximately 37,200 job openings annually through 2034.
- Median pre-tax annual earnings for nurses increase by 10%–16% with higher levels of education and professional advancement.
- Nurse practitioners represent the fastest-growing nursing role, with employment increasing by 61% since 2019.
- The Health Resources and Services Administration (HRSA) projects a 9% national RN shortage by 2036, with the shortage reaching 14% in non-metropolitan areas.
General Statistics
- The share of men in the nursing workforce declined from 11.2% in 2022 to 10.4% in 2024.
- 72.9% of registered nurses held a baccalaureate degree or higher as their highest level of nursing education in 2024.
- The 2024 RN workforce comprised 76.6% White/Caucasian, 8.6% Black/African American, 7.9% Asian, 3.5% other, 2.6% multiracial, 0.5% Native American or Alaska Native, and 0.3% Native Hawaiian or other Pacific Islander professionals.
- 7.2% of the RN workforce identified as Hispanic in 2024.
- Hospital RN turnover averaged 17.6% in 2025, resulting in an estimated USD 5.19 million in annual costs per hospital.
- The U.S. direct-care workforce included 1,448,910 nursing assistants and 4,305,810 home health and personal care aides.
- 68% of RNs provided direct patient care in their primary position in 2024, down from 73% in 2022.
- 88.4% of LPNs/LVNs were actively employed in nursing in 2024, the highest level since 2015, with 70.6% working full-time.
- The advanced practice registered nurse (APRN) workforce is projected to expand by approximately 35% from 2024 to 2034, driven by increasing demand for primary and specialty care and expanded scope-of-practice opportunities.
- In 2024, 17.4% of registered nurses held a master’s degree, while 2.7% held a doctoral degree as their highest educational qualification.
- In 2026, projected nursing workforce supply is expected to meet 91.94% of national demand, resulting in an 8.06% shortage. Licensed practical nurses are projected to face a 20% shortage, compared with 10% for registered nurses.
- The projected nursing shortage in non-metropolitan areas is expected to reach 25% in 2026, compared with 5% in metropolitan areas.
- Between 2026 and 2036, the projected nursing shortage is expected to average 14% in non-metropolitan areas and 2% in metropolitan areas.
- By 2038, the nursing shortage in non-metropolitan areas is projected to decline to 11%, while the shortage in metropolitan areas is expected to remain at 2%.
The U.S. Nursing Workforce by Generation
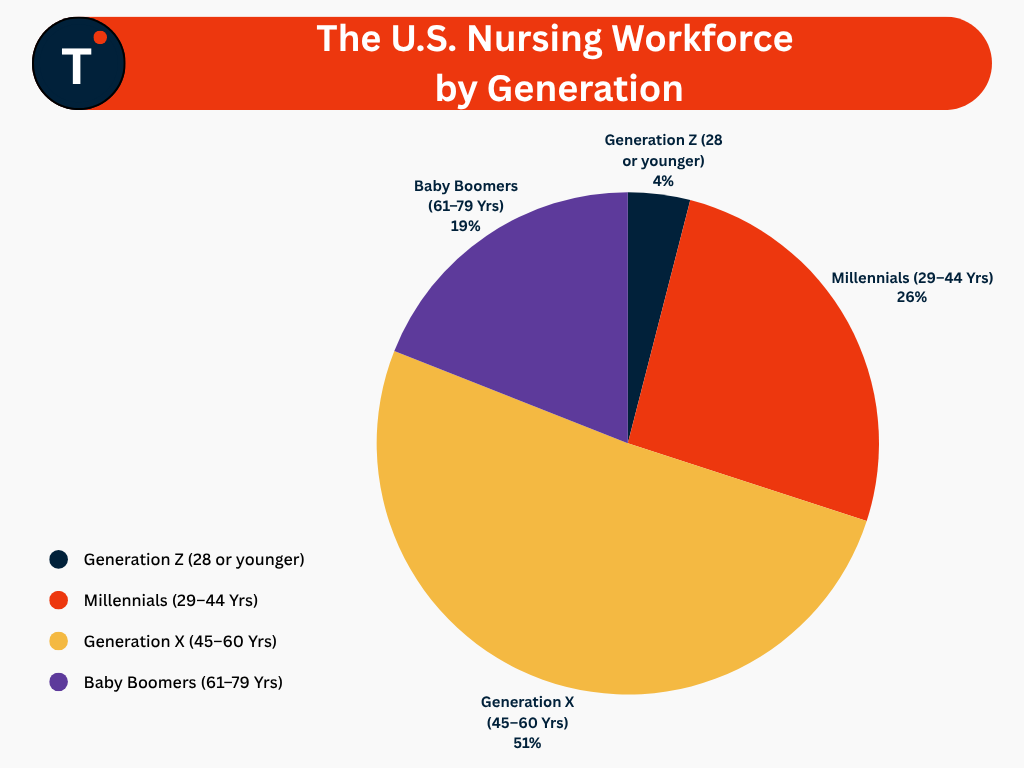
- Generation X represents the largest share of the nursing workforce at 51%, covering the 45–60 age group.
- Millennials account for 26% of the nursing workforce, representing individuals aged 29–44.
- Baby Boomers comprise 19% of the nursing workforce, covering the 61–79 age group.
- Generation Z represents 4% of the nursing workforce, consisting of individuals aged 28 or younger.
The U.S. Nursing Workforce Distribution by Gender, 2025
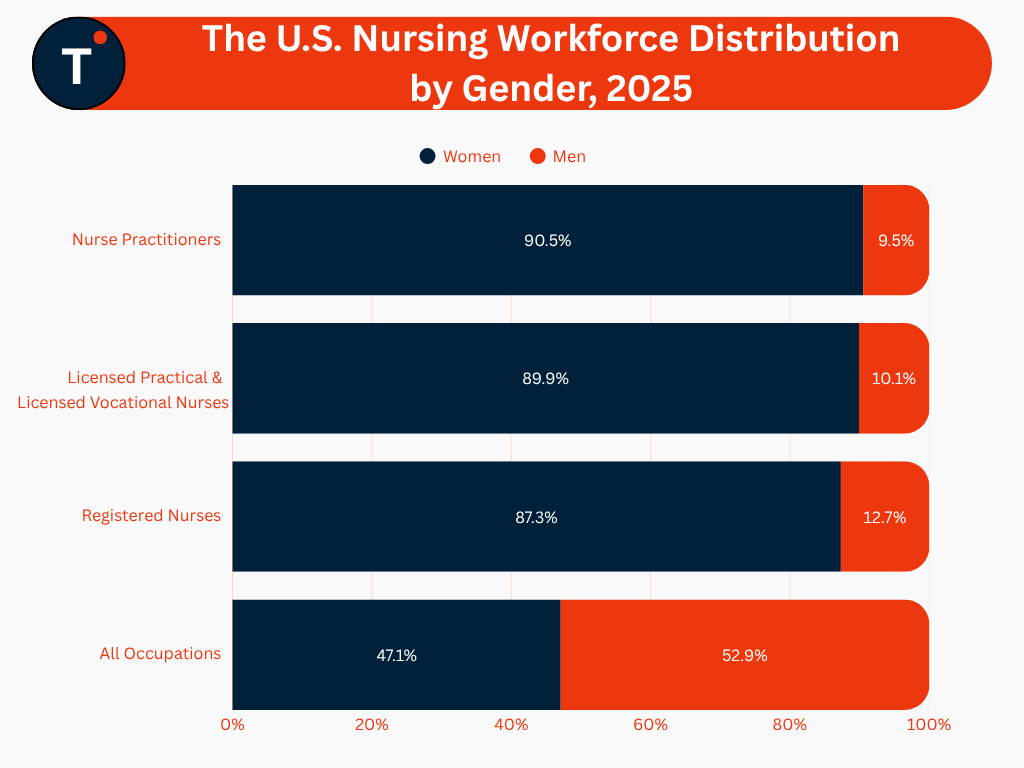
- Nurse practitioners comprise 90.5% women and 9.5% men, representing the highest female share among the listed nursing occupations.
- Licensed practical and licensed vocational nurses comprise 89.9% women and 10.1% men.
- Registered nurses comprise 87.3% women and 12.7% men.
- Across all occupations, women account for 47.1%, while men represent 52.9%.
Median Annual Salary by Education
- DNP qualification records the highest median annual salary at USD 137,500.
- PhD in Nursing corresponds to a median annual salary of USD 107,520.
- Master’s degree in nursing (MSN) records a median annual salary of USD 96,000.
- Master’s degree in a non-nursing field corresponds to a median annual salary of USD 90,000.
- BSN qualification records a median annual salary of USD 82,750.
- An associate degree corresponds to a median annual salary of USD 79,500.
- Bachelor’s degree in a non-nursing field records a median annual salary of USD 75,000.
- High school education corresponds to a median annual salary of USD 65,000.
- Nursing diploma records the lowest median annual salary at USD 60,000.
- Among the nursing-specific qualifications shown, median annual salary increases from USD 60,000 for a nursing diploma to USD 137,500 for a DNP, highlighting a substantial earnings differential across education levels.
Median Annual Salary by Nursing Position
- Advanced practitioners record the highest median annual salary at USD 130,000.
- Assistant managers have a median annual salary of USD 119,500.
- Directors record a median annual salary of USD 101,900.
- Managers have a median annual salary of USD 93,600.
- Supervisors record a median annual salary of USD 90,000.
- Case managers have a median annual salary of USD 88,500.
- Educator/staff development positions record a median annual salary of USD 80,000.
- Staff nurses have a median annual salary of USD 79,500.
- Charge nurses record a median annual salary of USD 75,000.
- School nurses have the lowest median annual salary at USD 63,250.
Nursing Shortage by State
| State | State Population* | RN Population (2026) | RN Population per 1,000 People (2026) | RN Demand: 2026 (and adequacy) | Projected RN Demand: 2030 (and adequacy) |
| Alabama | 5,193,088 | 61,060 | 11.84 | 55,050 (111%) | 56,430 (112%) |
| Alaska | 737,270 | 9,630 | 13.01 | 6,600 (146%) | 6,980 (133%) |
| Arizona | 7,623,818 | 58,220 | 7.68 | 70,230 (83%) | 76,060 (90%) |
| Arkansas | 3,114,791 | 28,020 | 9.07 | 32,500 (86%) | 32,960 (94%) |
| California | 39,355,309 | 289,820 | 7.35 | 332,410 (87%) | 350,540 (84%) |
| Colorado | 6,012,561 | 40,730 | 6.84 | 50,700 (80%) | 55,010 (86%) |
| Connecticut | 3,688,496 | 42,500 | 11.56 | 37,320 (114%) | 37,840 (109%) |
| Delaware | 1,059,952 | 1,059,952 | 10.99 | 10,810 (107%) | 11,440 (101%) |
| Florida | 23,462,518 | 214,830 | 9.19 | 229,770 (93%) | 247,650 (94%) |
| Georgia | 11,302,748 | 92,090 | 8.24 | 104,460 (88%) | 112,790 (85%) |
| Hawaii | 1,432,820 | 16,270 | 11.25 | 12,260 (133%) | 12,820 (130%) |
| Idaho | 2,029,733 | 11,800 | 5.9 | 18,100 (65%) | 19,180 (77%) |
| Illinois | 12,719,141 | 131,050 | 10.3 | 121,680 (108%) | 121,710 (107%) |
| Indiana | 6,973,333 | 67,610 | 9.76 | 70,820 (95%) | 72,750 (95%) |
| Iowa | 3,238,387 | 25,410 | 7.84 | 31,700 (80%) | 32,440 (88%) |
| Kansas | 2,977,220 | 25,330 | 8.53 | 28,000 (90%) | 28,700 (98%) |
| Kentucky | 4,606,864 | 43,430 | 9.47 | 52,950 (82%) | 54,710 (89%) |
| Louisiana | 4,618,189 | 37,240 | 8.1 | 49,580 (75%) | 50,610 (79%) |
| Maine | 1,414,874 | 13,620 | 9.69 | 15,240 (89%) | 16,420 (89%) |
| Maryland | 6,265,347 | 45,060 | 7.19 | 58,860 (77%) | 62,100 (78%) |
| Massachusetts | 7,154,084 | 76,060 | 10.66 | 68,270 (111%) | 71,180 (105%) |
| Michigan | 10,127,884 | 87,100 | 8.59 | 104,220 (84%) | 108,020 (81%) |
| Minnesota | 5,830,405 | 60,000 | 10.36 | 55,610 (108%) | 58,250 (108%) |
| Mississippi | 2,954,160 | 24,480 | 8.32 | 32,470 (88%) | 33,110 (92%) |
| Missouri | 6,270,541 | 56,330 | 9.02 | 65,110 (87%) | 66,570 (90%) |
| Montana | 1,144,694 | 11,420 | 10.04 | 11,050 (103%) | 11,520 (106%) |
| Nebraska | 2,018,006 | 17,790 | 8.87 | 19,270 (92%) | 19,940 (98%) |
| Nevada | 3,282,188 | 27,970 | 8.56 | 27,630 (101%) | 28,830 (107%) |
| New Hampshire | 1,415,342 | 12,230 | 8.68 | 14,230 (86%) | 15,360 (87%) |
| New Jersey | 9,548,215 | 81,250 | 8.55 | 85,360 (95%) | 88,010 (93%) |
| New Mexico | 2,125,498 | 14,010 | 6.58 | 19,000 (74%) | 19,500 (82%) |
| New York | 20,002,427 | 184,220 | 9.27 | 189,580 (97%) | 191,010 (97%) |
| North Carolina | 11,197,968 | 91,650 | 8.3 | 109,140 (84%) | 116,420 (83%) |
| North Dakota | 799,358 | 8,940 | 11.22 | 7,560 (118%) | 7,750 (128%) |
| Ohio | 11,900,510 | 123,020 | 10.35 | 124,600 (99%) | 125,810 (104%) |
| Oklahoma | 4,123,288 | 30,140 | 7.36 | 41,670 (72%) | 42,880 (77%) |
| Oregon | 4,273,586 | 42,580 | 9.97 | 41,020 (104%) | 43,870 (99%) |
| Pennsylvania | 13,059,432 | 117,060 | 8.95 | 139,820 (84%) | 145,350 (85%) |
| Rhode Island | 1,114,521 | 12,370 | 11.12 | 11,320 (109%) | 11,580 (109%) |
| South Carolina | 5,570,274 | 43,940 | 8.02 | 55,630 (79%) | 58,360 (82%) |
| South Dakota | 935,094 | 10,610 | 11.47 | 8,950 (119%) | 9,360 (125%) |
| Tennessee | 7,315,076 | 62,950 | 8.7 | 73,080 (86%)) | 76,290 (90%) |
| Texas | 31,709,821 | 239,030 | 7.64 | 253,610 (94%) | 271,920 (93%) |
| Utah | 3,538,904 | 29,010 | 8.28 | 27,270 (106%) | 29,990 (122%) |
| Vermont | 644,663 | 8,960 | 13.8 | 6,490 (138%) | 6,560 (131%) |
| Virginia | 8,880,107 | 58,750 | 6.67 | 84,420 (70%) | 88,180 (78%) |
| Washington | 8,001,020 | 61,820 | 7.77 | 70,970 (87%) | 76,770 (84%) |
| Washington, D.C. | 693,645 | 10,550 | 15.02 | 6,050 (174%) | 3,850 (163%) |
| West Virginia | 1,766,147 | 16,560 | 9.46 | 20,420 (81%) | 20,180 (92%) |
| Wisconsin | 5,972,787 | 61,200 | 10.3 | 57,760 (106%) | 59,270 (108%) |
| Wyoming | 588,753 | 10,750 | 18.3 | 5,300 (203%) | 5,380 (188%) |
Factors Impacting the Nursing Shortage
- Entry-level baccalaureate nursing program enrollment increased by 7.6% in 2025, while enrollment in PhD nursing programs declined by 3%, marking the 11th consecutive year of decline.
- U.S. nursing schools turned away 92,672 qualified applications to baccalaureate and graduate nursing programs in 2025 due to constraints involving faculty availability, clinical sites, classroom capacity, clinical preceptors, and budgets.
- Nearly 17,000 graduate nursing applications were turned away in 2025, limiting the potential pipeline of advanced-degree nurses who can transition into nurse educator roles.
- Nursing schools recorded 1,588 full-time faculty vacancies across 1,075 institutions, alongside a need for an additional 150 faculty positions to accommodate student demand.
- The national nursing faculty vacancy rate reached 7.2%, with 80.8% of vacant positions requiring or preferring a doctoral degree.
- 24% of nurses across all license types considered leaving the profession in 2025, up from 23% in 2024.
- Higher compensation ranked as the leading factor supporting nurse retention, followed by improved work-life balance and more manageable workloads.
- 62% of nurses experienced feelings of being overwhelmed, while 53% experienced burnout, highlighting workforce pressures affecting retention.
- Limited nursing education capacity, faculty shortages, and workforce stress collectively constrain the expansion and retention of the nursing workforce.
Impact of Nursing Staffing on Patient Care
- A one-unit increase in RN hours per patient day is associated with a 2% reduction in hospital length of stay, while a 1% increase in RN skill mix reduces hospital stays by 1%.
- Increasing staffing to 9 RN hours per patient day and achieving an 80% RN skill mix could save 63,580 inpatient days annually and reduce hospital costs by USD 152.9 million.
- A 10-percentage-point reduction in RN staffing is associated with 7% higher odds of in-hospital mortality, 1% higher odds of readmission, and a 2% increase in expected hospital days, alongside lower patient satisfaction.
- Reduced RN staffing could contribute to 10,947 avoidable deaths and 5,207 avoidable readmissions annually, resulting in an estimated USD 68.5 million in additional Medicare costs.
- Insufficient staffing levels among registered nurses and nursing assistants are associated with higher mortality risk, longer hospital stays, and increased incidence of deep vein thrombosis, pneumonia, and pressure ulcers.
- Overall, the statistics demonstrate a direct relationship between adequate nursing staffing, patient outcomes, hospital efficiency, and healthcare costs.
Most Desired Benefits Among Nurses
- Bonuses remain a leading desired benefit, with 40% of American Indian and Alaska Native nurses, 35% of White nurses, and 33% of Black or African American nurses prioritizing them.
- Generation Z nurses place greater emphasis on malpractice insurance and additional unpaid or family leave compared with other generations.
- 33% of LPNs/LVNs prioritize reimbursement and paid continuing education, followed by bonuses (29%) and malpractice insurance (25%).
- Among RNs, bonuses rank as the top desired benefit at 35%, followed by malpractice insurance (21%) and profit sharing (20%).
- 20% of female nurses prioritize wellness resources, compared with 15% of male nurses.
- 33% of male nurses prioritize malpractice insurance, compared with 20% of female nurses.
Workplace Factors Positively Affecting Nurses’ Mental Health
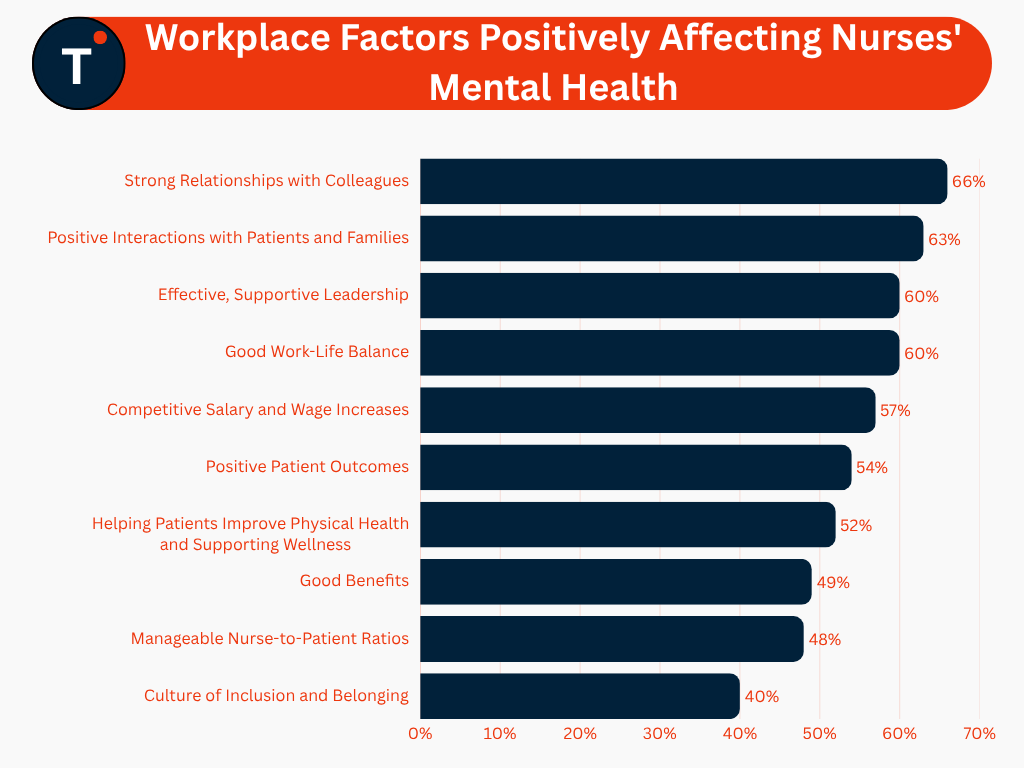
- 66% cite strong relationships with colleagues as a positive influence on mental health.
- 63% consider positive interactions with patients and families an important contributor to mental well-being.
- 60% highlight effective and supportive leadership as a key workplace factor.
- 60% place good work-life balance among the important factors supporting mental health.
- 57% value competitive salaries and wage increases as contributors to positive mental well-being.
- 54% link positive patient outcomes with better mental health.
- 52% view helping patients improve their physical health and supporting their wellness as a positive aspect of work.
- 49% consider good employee benefits important for mental well-being.
- 48% cite manageable nurse-to-patient ratios as a factor supporting positive mental health.
- 40% value a culture of inclusion and belonging as a contributor to workplace mental well-being.
Workplace Factors Negatively Affecting Nurses’ Mental Health
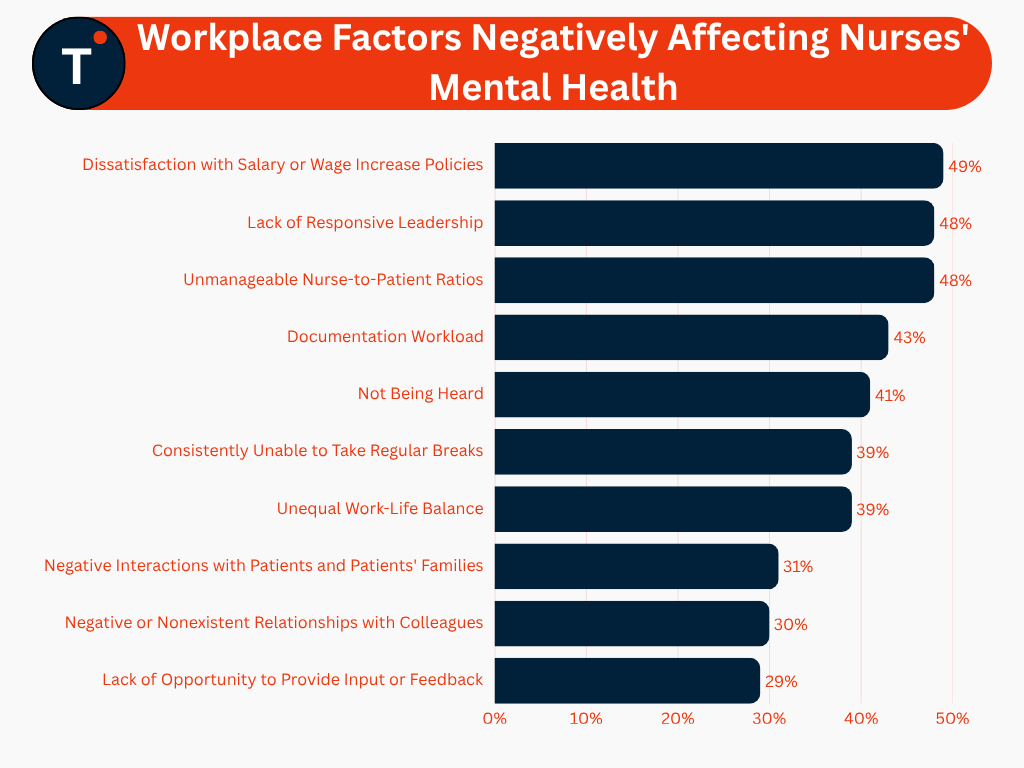
- 49% cite dissatisfaction with salary or wage increase policies as a negative workplace factor.
- 48% experience the impact of unresponsive leadership on workplace mental well-being.
- 48% are affected by unmanageable nurse-to-patient ratios.
- 43% face documentation workload as a workplace challenge affecting mental health.
- 41% experience negative effects from not being heard in the workplace.
- 39% face difficulties due to consistently being unable to take regular breaks.
- 39% experience an unequal work-life balance.
- 31% are affected by negative interactions with patients and patients’ families.
- 30% experience negative or nonexistent relationships with colleagues.
- 29% face limited opportunities to provide workplace input or feedback.
Prevalence of Work-Related Stressors Among Nurses
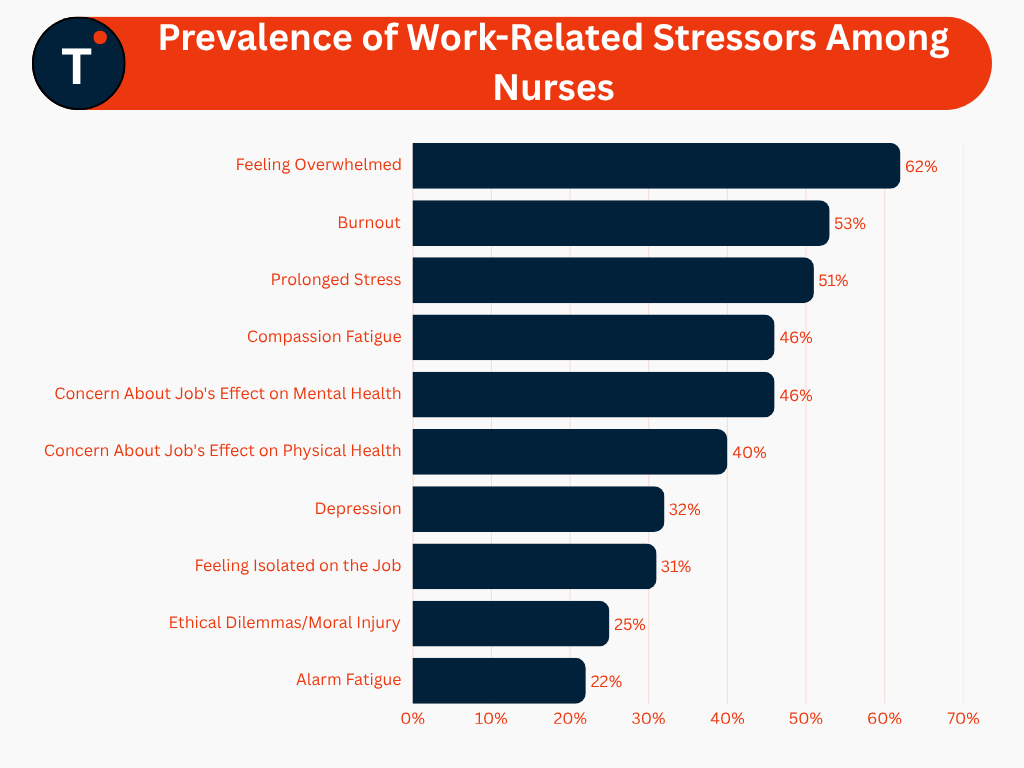
- 62% of nurses face feeling overwhelmed, representing the highest prevalence among the listed stressors.
- 53% are affected by burnout.
- 51% face prolonged workplace stress.
- 46% are affected by compassion fatigue.
- 46% express concern over the impact of their job on mental health.
- 40% face concerns related to the impact of their job on physical health.
- 32% are affected by depression.
- 31% face feelings of isolation at work.
- 25% encounter ethical dilemmas or moral injury.
- 22% are affected by alarm fatigue, recording the lowest prevalence among the listed factors.
Key Factors Influencing Nurses’ Overall Job Satisfaction
- 74% of nurses consider regular merit increases important to overall job satisfaction, making it the leading factor.
- 63% place importance on the ability to practice to the full scope of nursing practice.
- 58% consider the manager an important factor in overall job satisfaction.
- 44% place importance on the mission of the organization.
- 43% consider advancement opportunities important to job satisfaction.
- 38% value tuition reimbursement as a contributor to overall job satisfaction.
- 26% consider overtime opportunities important, representing the lowest share among the listed factors.
Top Reasons for Leaving the Previous Nursing Position
- 53% cite better pay as a reason for leaving their previous position, making it the leading factor.
- 49% cite dissatisfaction with management as a key reason for leaving.
- 38% leave due to family, external responsibilities, or other personal circumstances.
- 38% leave for a career change within the nursing profession.
- 24% leave for a position offering lower risk to mental health.
- 23% leave for more flexible working hours.
- 22% leave for better employee benefits.
- 22% leave after switching nursing specialties.
- 21% leave to pursue a management opportunity.
- 18% leave for a position offering lower risk to physical health, representing the lowest share among the listed factors.
Top Factors Motivating Nurses to Remain in the Profession
- 59% prioritize higher pay as the leading factor supporting retention in nursing.
- 30% value better work-life balance support as an important factor for remaining in the profession.
- 28% prioritize flexible scheduling.
- 26% consider better benefits an important factor supporting continued employment in nursing.
- 21% value the ability to work in a remote role, representing the lowest share among the listed factors.
Rise of Travel Nursing and Flexible Work
- Travel nurses accounted for approximately 1% of the U.S. RN workforce before the pandemic, rising to more than 5% in 2021–2022 as hospitals addressed workforce shortages and nurse turnover.
- Travel RNs have a younger age profile, with only 13% aged over 55, compared with a median age of 50 years across the overall nursing workforce.
- 51% of RNs pursue supplemental income beyond their primary salaries, highlighting strong demand for flexible earning opportunities.
- 55% of RNs pursuing additional income work extra shifts, overtime, weekends, or holidays, providing additional coverage for workforce gaps.
- 27% generate supplemental income through preceptor roles.
- 24% take on-call shifts to supplement their earnings.
- 23% assume charge nurse responsibilities for additional income.
- 22% work a second non-nursing job as an additional income source.
- 14% supplement their income through teaching opportunities.
Specialty Distribution Among Registered Nurses (RNs), 2022 vs. 2024
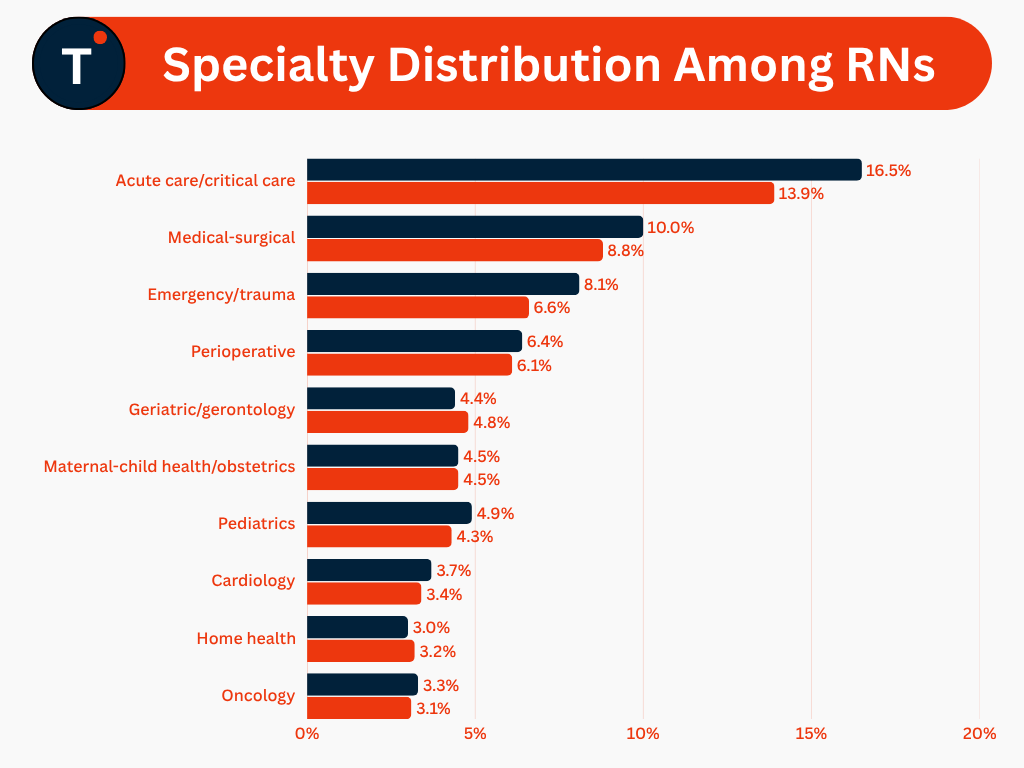
- Acute care/critical care represents the largest RN specialty segment, declining from 16.5% in 2022 to 13.9% in 2024.
- Medical-surgical nursing accounted for 10.0% in 2022, decreasing to 8.8% in 2024.
- Emergency/trauma nursing declined from 8.1% in 2022 to 6.6% in 2024.
- Perioperative nursing decreased from 6.4% in 2022 to 6.1% in 2024.
- Geriatric/gerontology increased from 4.4% in 2022 to 4.8% in 2024.
- Maternal-child health/obstetrics remained stable at 4.5% in both 2022 and 2024.
- Pediatrics declined from 4.9% in 2022 to 4.3% in 2024.
- Cardiology decreased from 3.7% in 2022 to 3.4% in 2024.
- Home health increased from 3.0% in 2022 to 3.2% in 2024.
- Oncology declined from 3.3% in 2022 to 3.1% in 2024.
Primary Practice Settings of RNs and LPNs/LVNs
| Practice setting | RNs | LPNs/LVNs |
| Hospitals | 53.3% | 11.9% |
| Ambulatory care | 11.5% | 9.1% |
| Assisted living facility | 0.5% | 6.3% |
| Nursing homes/extended care | 4.7% | 31.6% |
| Home health | 3.5% | 10.3% |
| Other | 26.5% | 30.8% |
- 53.3% of RNs practice in hospitals, making them the primary practice setting for registered nurses.
- 26.5% of RNs fall under other practice settings, including hospice, correctional facilities, public health, dialysis centers, community health, school health services, and occupational health.
- 11.5% of RNs work in ambulatory care settings.
- 4.7% of RNs practice in nursing homes or extended-care facilities.
- 3.5% of RNs work in home health.
- 0.5% of RNs practice in assisted living facilities.
- 31.6% of LPNs/LVNs work in nursing homes or extended-care facilities, representing their largest practice setting.
- 30.8% of LPNs/LVNs fall under other practice settings.
- 11.9% of LPNs/LVNs work in hospitals.
- 10.3% of LPNs/LVNs practice in home health.
- 9.1% of LPNs/LVNs work in ambulatory care.
- 6.3% of LPNs/LVNs practice in assisted living facilities.
Most Effective Outreach Channels for Nurse Recruitment
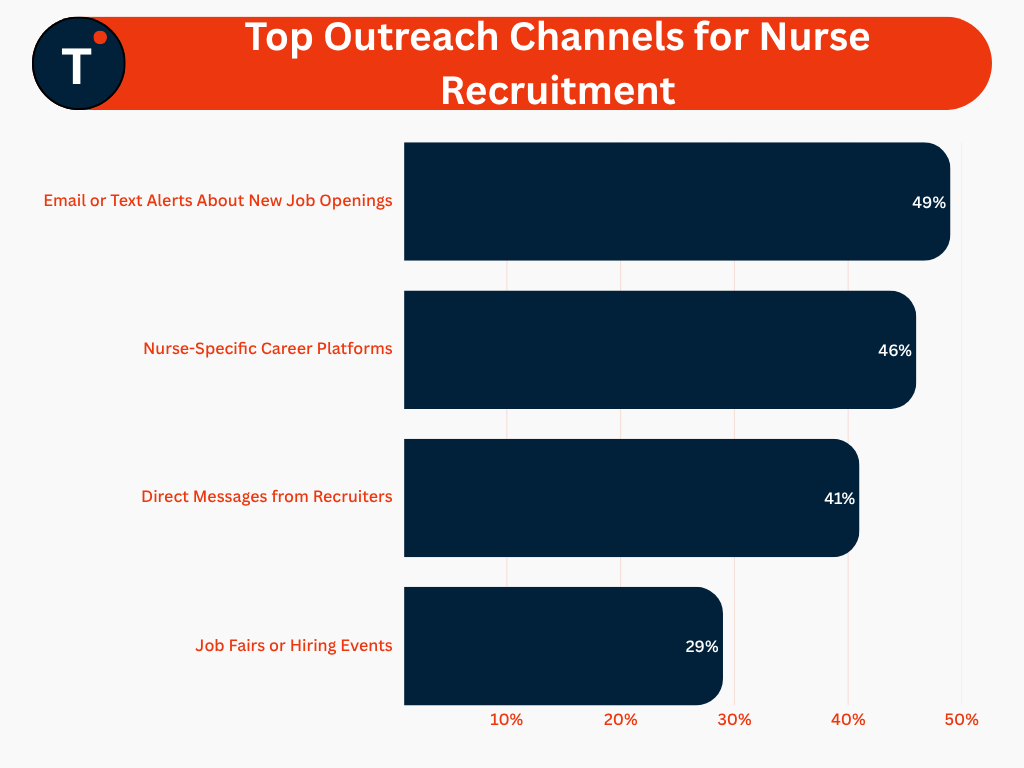
- 49% of nurses rank email or text alerts about new job openings among the most effective recruitment channels.
- 46% favor nurse-specific career platforms as an effective channel for job opportunities.
- 41% consider direct messages from recruiters an effective recruitment approach.
- 29% rank job fairs or hiring events among the most effective outreach channels.
Nurses’ Most Recent Job Sources
- 32% of nurses secured their most recent position through online job boards, making them the leading recruitment source.
- 26% obtained their most recent position through referrals from colleagues or friends.
- 15% were recruited directly by a healthcare facility or agency.
- 14% secured their position through an internal transfer or promotion.
Median Years of Nursing Experience by Race and Ethnicity
- White nurses record a median of 23 years of nursing experience.
- Native Hawaiian or Other Pacific Islander nurses also record a median of 23 years.
- Asian nurses have a median of 17 years of nursing experience.
- Hispanic, Latinx, or Spanish nurses record a median of 15 years.
- Black or African American nurses have a median of 13.5 years.
- American Indian or Alaska Native nurses record the lowest median at 12 years.
Conclusion
- The nursing workforce continues to play a central role in healthcare delivery, with workforce size, educational attainment, specialization, and practice settings shaping its overall composition.
- Persistent nursing shortages, faculty constraints, workforce aging, turnover, and geographic disparities continue to influence the availability and distribution of nursing professionals.
- Compensation, career advancement, benefits, work-life balance, flexible scheduling, and supportive leadership remain key factors affecting nurse retention and job satisfaction.
- Workforce conditions such as staffing levels, workload, nurse-to-patient ratios, and workplace relationships have significant implications for nurses’ mental well-being and patient care outcomes.
- The increasing presence of advanced practice roles, travel nursing, supplemental income opportunities, and flexible work arrangements reflects the changing structure of the nursing workforce.
- Overall, the statistics highlight the importance of strengthening workforce development, improving retention, expanding nursing education capacity, maintaining adequate staffing, and supporting nurse well-being to ensure a stable and sustainable nursing workforce.