

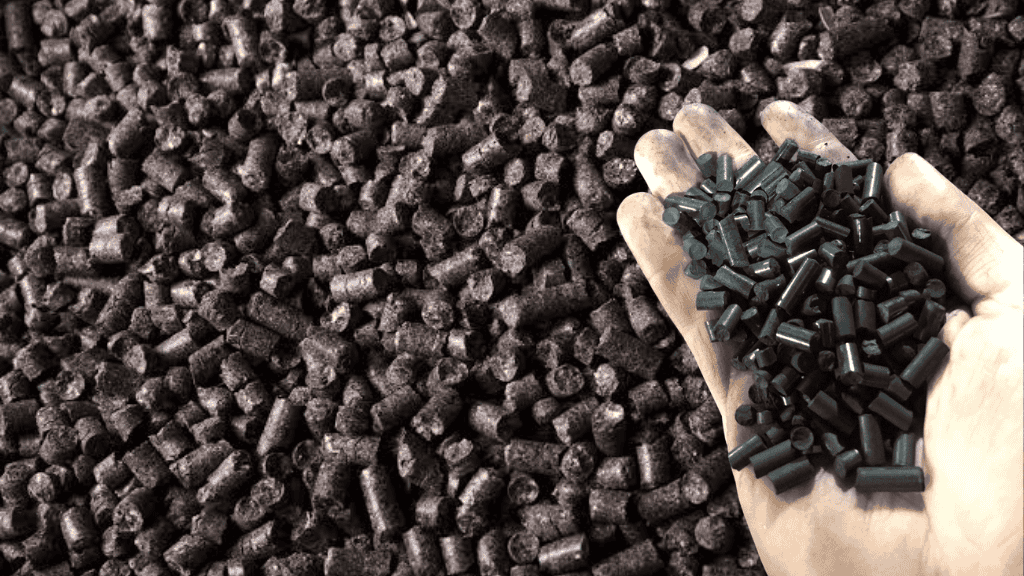


Black pellets are renewable biomass fuels that can serve as an alternative to fossil coal in power generation, helping reduce carbon emissions. Global production, consumption, and international trade of black pellets are expanding, with North America supplying growing volumes to Europe and East Asia for heat and electricity generation.
Black pellet production involves an additional biomass treatment stage before the conventional pelleting process. The feedstock is generally treated through torrefaction or steam explosion before pelletization. In the torrefaction process, biomass is heated to approximately 280–320°C under low-oxygen conditions for a specified period before being processed into pellets.
Editor’s Picks
- Global black pellet consumption reached 523.10 kilo tons in 2025 and is estimated to increase to 2,030.86 kilo tons by 2035, reflecting a volume CAGR of 14.6%.
- Black pellet consumption in the US stood at 101.48 kilo tons in 2025 and is projected to reach 437.14 kilo tons by 2035, registering a volume CAGR of 15.8%.
- Europe consumed 275.55 kilo tons of black pellets in 2025, with consumption projected to reach 951.80 kilo tons by 2035, at a CAGR of 13.3%.
- The FOB price of black pellets averaged US$224.62 per ton in 2025 and is expected to reach US$240.15 per ton by 2035.
- Black pellets offer 30% higher energy density than white pellets, supporting greater energy content per unit of fuel.
- Black pellets provide shipping cost advantages over white pellets, supported by higher wet and dry durability, 15% higher energy content per ton, and 15% higher bulk density. These characteristics can generate 30% shipping savings compared with white pellets, irrespective of prevailing fuel prices.
- Japan’s mandatory emissions trading scheme, launched in April 2026, is encouraging utilities to consider black pellet co-firing. Utility companies are entering long-term offtake agreements to co-fire black pellets at 10–20% ratios rather than shutting down highly efficient ultra-supercritical (USC) coal plants.
- More than 30 active fuel pellet projects are under development across North America, representing a combined investment value of more than US$1.6 billion.
- Europe remains a major destination for North American fuel pellet exports. According to the U.S. Department of Agriculture (USDA), the US exported more than 608,500 metric tons of fuel pellets in February 2026, compared with 964,860.7 metric tons in January 2026. During January and February 2026, US fuel pellet exports totaled 1.57 million metric tons, valued at US$305.66 million, compared with 1.62 million metric tons valued at US$305.88 million during the corresponding period in 2025.
- The UK was the leading destination for US fuel pellet exports in February 2026, receiving more than 471,000 metric tons, followed by Denmark with 44,334 metric tons.
General Statistics
- Black pellets generate 94% less carbon footprint than coal, while retaining 87.5% of coal’s energy release.
- Black pellet production costs 40–50% more per tonne than white pellet production.
- The Southern United States has 91 wood pellet manufacturing plants, representing 75% of total US wood pellet production.
- Black pellets can replace fossil coal by up to 100% in smaller units and up to 70% in larger units, supporting higher levels of coal substitution in power generation.
- Using harvest slash residues for pellet production instead of open burning can reduce local PM2.5 pollution by 88%.
- The Pacific Northwest (PNW), particularly Washington and Oregon, has a well-established sustainable forestry industry. Third-party certification covers 91.3% of Washington’s working forests and 53.4% of Oregon’s working forests, through the Sustainable Forestry Initiative (SFI), Forest Stewardship Council (FSC), or American Tree Farm System (ATFS).
- The Pacific Northwest generates around 9.9 million dry metric tons of harvest residues and 5 million dry tons of mill residues annually. Between 2 million and 4 million dry metric tons of this residual biomass could support economically viable pellet production in the region.
- Black pellets have a calorific value of 19.5 MJ/kg, comparable to steam coal and higher than white pellets.
- Black pellets have a bulk density of 750 kg/m³, exceeding the bulk density of coal and white pellets.
- Black pellets contain 1% particulate fines, resulting in lower fines content than coal and white pellets.
- Black pellets have an ash content of 0.5%, resulting in less ash requiring disposal compared with coal, which has an ash content of 38%, while also producing lower emissions.
What is the Difference Between Wood Pellets and Torrefied Pellets?
| Wood Pellets | Torrefied Pellets |
| Light brown | Black, coal-like |
| 3-5% co-firing ratio | Up to 100% co-firing ratio |
| Sensitive to moisture | Weather resistant |
| Lower calorific value | Higher calorific value |
| 16-17 MJ/kg | ≥19 MJ/kg |
| Difficult to grind in coal mills | Coal-like grindability |
| Self-heating hazard | Non-hazardous |
What Is the Global Black Pellets Market Size and Growth Outlook?

- Worldwide black pellet consumption stood at 523.10 kilo tons in 2025.
- Demand for black pellets is estimated at 593.48 kilo tons in 2026.
- By 2035, global black pellet consumption is projected to reach 2,030.86 kilo tons, reflecting a volume CAGR of 14.6%.
- The global black pellets market generated US$117.50 million in 2025.
- Sales of black pellets are expected to reach US$133.78 million in 2026.
- By 2035, black pellet sales are forecast to reach US$487.71 million, expanding at a market value CAGR of 15.5%.

Global Black Pellets Market by Region

- Europe dominated the global black pellets market with a 58.5% market share in 2025. The Europe black pellets market was valued at US$68.79 million in 2025 and is estimated to reach US$259.50 million by 2035, with a CAGR of 14.3%.
- North America was the second-largest region in the global black pellets market, accounting for 21.9% in 2025. The North America black pellets market is projected to reach US$119.48 million by 2035 from US$25.77 million in 2025, with a CAGR of 16.7%.
- Asia Pacific is expected to account for 17.6% of the global black pellets market by 2035. The Asia Pacific black pellets market is anticipated to reach US$86.03 million by 2035 from US$14.47 million in 2025, registering a CAGR of 19.7%.
- The Middle East & Africa black pellets market was valued at US$3.12 million in 2025. The market is expected to reach US$7.78 million by 2035, with a CAGR of 9.7%.
- The Latin America black pellets market is projected to reach US$14.92 million by 2035 from US$5.35 million in 2025, with a CAGR of 10.9%.
Which Countries Have the Highest Demand for Black Pellets?
| Country | 2025 (US$ Million) | 2035 (US$ Million) | CAGR (2026-2035) |
| The US | 21.64 | 101.83 | 16.9% |
| Italy | 14.98 | 66.37 | 16.2% |
| U.K. | 12.46 | 34.43 | 10.8% |
| Germany | 10.04 | 42.59 | 15.7% |
| France | 9.47 | 38.08 | 15.1% |
| Russia & CIS | 5.79 | 17.19 | 11.6% |
| Japan | 4.30 | 29.16 | 21.2% |
| Spain | 4.15 | 11.69 | 11.0% |
| Canada | 4.13 | 17.65 | 15.8% |
What Technologies Are Used to Produce Black Pellets?
| Technology | 2025 (US$ Mn) | 2030 (US$ Mn) | 2035 (US$ Mn) |
| Torrefaction | 63.23 | 126.10 | 259.08 |
| Steam Explosion | 49.84 | 99.64 | 214.81 |
| Hydrothermal Carbonization | 4.43 | 7.86 | 13.83 |
- Torrefaction was the leading technology for black pellet production globally, accounting for 53.8% of the market in 2025.
- Sales of black pellets produced through torrefaction technology were valued at US$63.23 million in 2025 and are projected to reach US$259.08 million by 2035, registering a CAGR of 15.3%.
- Steam explosion technology is projected to account for 44% of the global black pellets market by 2035.
- Black pellet sales produced through steam explosion technology are expected to increase from US$49.84 million in 2025 to US$214.81 million by 2035, reflecting a CAGR of 15.9%.
- Black pellet sales produced through hydrothermal carbonization technology were valued at US$4.43 million in 2025 and are projected to reach US$13.83 million by 2035, registering a CAGR of 12.1%.
Which Feedstocks Are Used to Produce Black Pellets?

- Wood residue was the leading feedstock for black pellet production, accounting for 64.6% of the market in 2025.
- Black pellets produced from wood residue generated US$75.93 million in 2025 and are projected to reach US$322.09 million by 2035, registering a CAGR of 15.7%.
- Agricultural residues ranked as the second-largest feedstock for black pellet production, with a 21.9% market share in 2025.
- Black pellet sales from agricultural residues amounted to US$25.79 million in 2025 and are expected to reach US$112.07 million by 2035, reflecting a CAGR of 16.0%.
- Energy crops accounted for 7.5% of the black pellets market in 2025. Black pellet sales produced from energy crops were valued at US$8.80 million in 2025 and are estimated to reach US$27.99 million by 2035, at a CAGR of 12.4%.
Global Black Pellets Market by Application

- Heat generation was the largest application in the global black pellets market, accounting for 54.8% of the market in 2025.
- The black pellets market for heat generation was valued at US$64.41 million in 2025 and is projected to reach US$255.48 million by 2035, reflecting a CAGR of 14.9%.
- Power generation is projected to account for 37.5% of the global black pellets market by 2035.
- The value of black pellets used for power generation is expected to increase from US$41.27 million in 2025 to US$183.11 million by 2035, registering a CAGR of 16.3%.
- Combined heat and power (CHP) accounted for 10.1% of the global black pellets market in 2025.
- The CHP segment was valued at US$11.83 million in 2025 and is estimated to reach US$49.12 million by 2035, at a CAGR of 15.5%.
Global Black Pellets Market by End-use

- The residential sector dominated the global black pellets market with a 44.7% share in 2025.
- Demand for black pellets in the residential sector was valued at US$52.55 million in 2025 and is estimated to reach US$216.15 million by 2035, registering a CAGR of 15.3%.
- The commercial sector accounted for 17.6% of the global black pellets market in 2025, with a value of US$20.62 million.
- By 2035, the commercial sector is expected to reach US$74.21 million, growing at a CAGR of 13.8%.
- The industrial sector is expected to account for 40.5% of global black pellets demand by 2035.
- Industrial demand for black pellets is projected to increase from US$44.33 million in 2025 to US$197.36 million by 2035, reflecting a CAGR of 16.3%.
How Much Do Black Pellets Cost per Ton?

- Black pellets produced using torrefaction technology were priced at US$207.92 per ton in 2025 and are expected to reach US$221.57 per ton by 2035.
- The price of black pellets produced through steam explosion technology was US$246.22 per ton in 2025 and is projected to reach US$263.72 per ton by 2035.
- Black pellets produced through hydrothermal carbonization technology were priced at US$267.17 per ton in 2025 and are forecast to reach US$293.96 per ton by 2035.
Recent Black Pellets Industry Developments
- In August 2026, Power Wood Holdings Ltd. agreed to invest up to CA$84 million in the development of two advanced black pellet production facilities in Northern Alberta.
- In April 2026, Genesis Energy and Nature’s Flame signed an agreement to advance feasibility studies and negotiations for the production and supply of torrefied biomass for electricity generation at Huntly Power Station. Genesis is targeting a supply of up to 300,000 tonnes of torrefied biomass (black pellets) annually by FY28, for use where economically feasible to replace a portion of coal used for energy security generation in Huntly’s Rankine units.
- In January 2026, POWERWOOD Canada Corp. agreed to purchase 175 acres of land in Northern Alberta from Mackenzie County for the construction of a rail spur. The infrastructure is intended to support the transportation of advanced black biofuel pellets to Canada’s tidewater.
- In September 2025, Kobe Steel’s black pellet production feasibility study project in Malaysia and Vietnam was selected under Japan’s Ministry of Economy, Trade and Industry (METI) FY2024 supplementary budget Global South Future-Oriented Co-Creation Project Subsidy Program for Small-Scale Demonstration/FS Projects.
- In June 2025, PEARL Infrastructure Capital II SCA (PEARL), a Luxembourg-headquartered environmental infrastructure investment firm, acquired a 65% stake in Norway-based advanced black pellet producer Arbaflame AS.
- In April 2025, Valmet and Wilhelmina announced a strategic collaboration to commercialize TG2 pellet technology globally.
Conclusion
- The black pellets market is transitioning from a niche biomass fuel toward a more commercially viable alternative to coal, supported by rising consumption, expanding production capacity, and increasing interest in lower-carbon energy sources.
- Europe continues to represent the strongest market base, while North America and Asia Pacific are gaining momentum through new investments, production projects, and growing demand.
- Advancements in torrefaction and steam explosion technologies are strengthening black pellet production capabilities, with continued investment in improving fuel quality, energy density, and production efficiency.
- Growing adoption in heat generation, power generation, and combined heat and power is creating wider opportunities for black pellets, particularly where coal substitution and co-firing are being considered.
- The favorable fuel characteristics of black pellets, including higher energy density, greater durability, and lower carbon emissions than coal, are supporting their use in existing energy infrastructure.
- Recent investments, feasibility studies, strategic partnerships, and new production projects indicate increasing industry commitment to expanding black pellet availability and establishing a larger-scale commercial supply chain.